In 1979 William Cleveland published the LOESS (or LOWESS) technique for smoothing data, and in 1988 he and Susan J. Devlin published a refined version of the technique (references are given at the end of this article). For each X value where a Y value is to be calculated, the LOESS technique performs a regression on points in a moving range around the X value, where the values in the moving range are weighted according to their distance from this X value.
The NIST Engineering Statistics Handbook has a good description of the LOESS technique, including a worked example. A commenter named Nick used the NIST chapter as a starting point for his implementation of a LOESS function for Excel, and he posted in in a comment on JunkCharts. Nick’s approach was to create a UDF in VBA. The UDF accepts as inputs the X and Y data ranges, the number of points to use in the moving regression, and the X value for which to calculate Y. Nick’s UDF used Dictionary objects to hold intermediate values, and it outputs the Y value for the input X value.
I’ve expanded on Nick’s starting point, and produced the function presented later in this article. I’ve discarded the Dictionary objects in favor of VB arrays. It accepts the input X and Y data and the output X values either as ranges or as vertical arrays, and it outputs the calculated LOESS Y values as a vertical array. This means it can be called from within other procedures using arrays, or as a UDF from a worksheet, as an array formula. The original data must be sorted by X in either ascending or descending order (Nick’s Dictionaries do not require sorted input data, and I have an idea to remove the requirement from my function).
My algorithm, Nick’s original algorithm I based mine on, the NIST algorithm Nick based his upon, and all others I checked in the wild use a linear regression of the weighted values, and the weighting factor for input data point i is a sigmoidal curve based on
W(i) = (1 - X(i)^3)^3where X(i) is the normalized distance (along the X axis) between input data point i and the output X value at which the LOESS smoothed value is being computed. The normalization X is the distance/(maximum distance among points in the moving regression).
To use the function as a UDF, select the multicell output Y range, and enter this formula:
=loess(C2:C22,D2:D22,F2:F21,7)where C2:C22 and D2:D22 are the input X and Y ranges, F2:F21 is the output X range, and 7 is the number of points in the moving regression (see screenshot below).
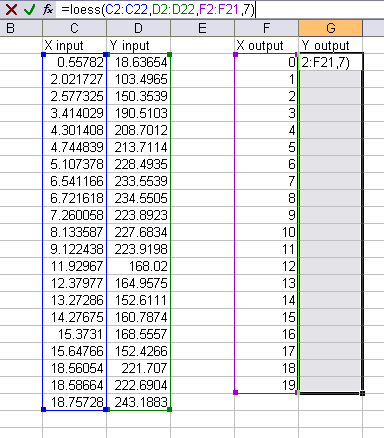
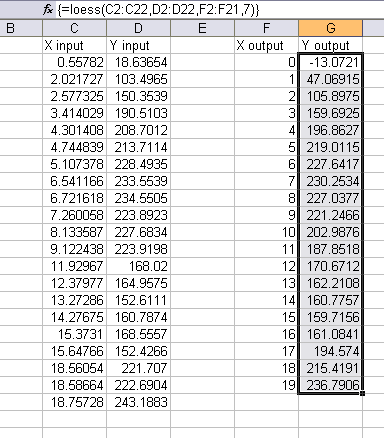
Enter this as an array formula by holding Ctrl and Shift while pressing Enter, and the selection fills with the calculated Y values. Note the curly braces around the formula in the formula bar, which indicates the formula is an array formula.
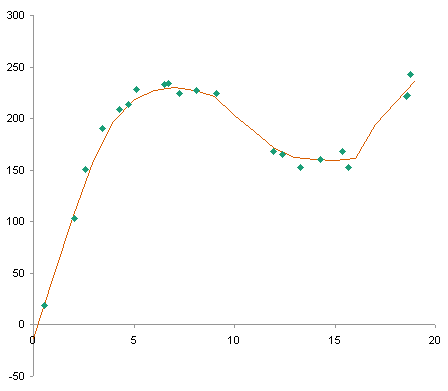
This chart shows the original NIST data points and the smoothed LOESS curve.
In Local regression, Wikipedia has a decent description of LOESS, with some pros and cons of this approach compared to other smoothing methods.
Example Uses of LOESS
This chart compares LOESS smoothing of website statistics with a simple 7-day moving average. The LOESS captures the major trends in the data, but is less severely affected by week to week fluctuations such as those occuring around Thanksgiving and over the year-end and New Year holidays.

Using LOESS to analyze the body mass indexes (BMI) of Playboy playmates gives more insights than linear regression over the whole data set or over portions of the data. See the discussion in Wired Relates Playboy Playmate BMI and Average BMI, 1954-2008 on the FlowingData blog.

The LOESS Function
Public Function LOESS(X As Variant, Y As Variant, xDomain As Variant, nPts As Long) As Double()
  Dim i As Long
  Dim iMin As Long
  Dim iMax As Long
  Dim iPoint As Long
  Dim iMx As Long
  Dim mx As Variant
  Dim maxDist As Double
  Dim SumWts As Double, SumWtX As Double, SumWtX2 As Double, SumWtY As Double, SumWtXY As Double
  Dim Denom As Double, WLRSlope As Double, WLRIntercept As Double
  Dim xNow As Double
  Dim distance() As Double
  Dim weight() As Double
  Dim yLoess() As Double

  If TypeName(X) = "Range" Then
    X = X.Value
  End If

  If TypeName(Y) = "Range" Then
    Y = Y.Value
  End If

  If TypeName(xDomain) = "Range" Then
    xDomain = xDomain.Value
  End If

  ReDim yLoess(LBound(xDomain, 1) To UBound(xDomain, 1), 1 To 1)

  For iPoint = LBound(xDomain, 1) To UBound(xDomain, 1)

    iMin = LBound(X, 1)
    iMax = UBound(X, 1)

    xNow = xDomain(iPoint, 1)

    ReDim distance(iMin To iMax)
    ReDim weight(iMin To iMax)

    For i = iMin To iMax
      ' populate x, y, distance
      distance(i) = Abs(X(i, 1) - xNow)
    Next

    Do
      ' find the nPts points closest to xNow
      If iMax + 1 - iMin <= nPts Then Exit Do
      If distance(iMin) > distance(iMax) Then
        ' remove first point
        iMin = iMin + 1
      ElseIf distance(iMin) < distance(iMax) Then
        ' remove last point
        iMax = iMax - 1
      Else
        ' remove both points?
        iMin = iMin + 1
        iMax = iMax - 1
      End If
    Loop

    ' Find max distance
    maxDist = -1
    For i = iMin To iMax
      If distance(i) > maxDist Then maxDist = distance(i)
    Next

    ' calculate weights using scaled distances
    For i = iMin To iMax
      weight(i) = (1 - (distance(i) / maxDist) ^ 3) ^ 3
    Next

    ' do the sums of squares
    SumWts = 0
    SumWtX = 0
    SumWtX2 = 0
    SumWtY = 0
    SumWtXY = 0
    For i = iMin To iMax
      SumWts = SumWts + weight(i)
      SumWtX = SumWtX + X(i, 1) * weight(i)
      SumWtX2 = SumWtX2 + (X(i, 1) ^ 2) * weight(i)
      SumWtY = SumWtY + Y(i, 1) * weight(i)
      SumWtXY = SumWtXY + X(i, 1) * Y(i, 1) * weight(i)
    Next
    Denom = SumWts * SumWtX2 - SumWtX ^ 2

    ' calculate the regression coefficients, and finally the loess value
    WLRSlope = (SumWts * SumWtXY - SumWtX * SumWtY) / Denom
    WLRIntercept = (SumWtX2 * SumWtY - SumWtX * SumWtXY) / Denom
    yLoess(iPoint, 1) = WLRSlope * xNow + WLRIntercept

  Next

  LOESS = yLoess

End Function
The LOESS Utility
The flexibility of this LOESS function will make it easy to encapsulate into an add-in that uses a dialog to facilitate user selection of data and parameters. A working version uses the following dialog:

Update 24 June 2009
A LOESS utility for Excel has finally been developed. It is described in LOESS Utility for Excel.
Update 8 October 2009
The LOESS utility for Excel has been updated, and the interface made more flexible. It is described in LOESS Utility – Awesome Update.
LOESS Smoothing in Peltier Tech Charts for Excel
I liked this utility and used it so much, that I have included it in my commercial Excel Charting software, Peltier Tech Charts for Excel.
I’ve made numerous improvements to this utility in the seven years since I released the free demo in this article. The ones that come to mind off the top of my head:
- Data Improvement:
- Data is internally sorted by X prior to running the analysis.
- Missing data (X or Y) is ignored during the analysis.
- Algorithms are less sensitive to factors that previously caused errors (too much input at repeated X values, too few points in the analysis).
- If X output prediction range extends beyond X input data range, you can decide not to extrapolate below minimum or above maximum X values.
- Algorithm Improvement:
- You can use a moving quadratic (2nd order) regression instead of the normal 1st order regression. This is slower than the first order computation, but not as much slower as I feared.
Articles About Regression and Trendlines on this Blog
- Trendlines and Chart Types in Excel
- Add One Trendline for Multiple Series
- Trendline Calculator for Multiple Series
- Trendline Fitting Errors
- Choosing a Trendline Type
- Plot Two Time Series and Trendlines with Different Dates
- Polynomial Fit vs. Statistical Process Control
- Moving Averages
- Stacked Column Chart with Stacked Trendlines
- Deming Regression
- Deming Regression Utility
- LOESS Utility for Excel
References
Cleveland, W.S. (1979), “Robust Locally Weighted Regression and Smoothing Scatterplots,” Journal of the American Statistical Association, Vol. 74, pp. 829-836.
Cleveland, W.S. and Devlin, S.J. (1988), “Locally Weighted Regression: An Approach to Regression Analysis by Local Fitting,” Journal of the American Statistical Association, Vol. 83, pp. 596-610.
NIST Engineering Statistics Handbook, 4.1.4.4. LOESS (aka LOWESS)
NIST Engineering Statistics Handbook, Example of LOESS Computations
Wikipedia, Local regression


