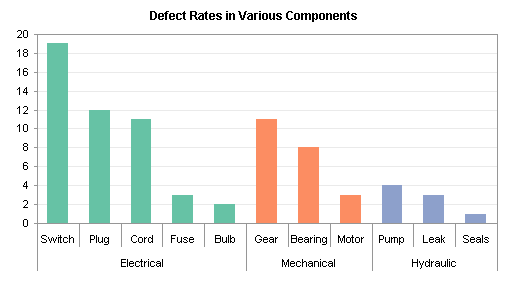
A reader named Julie has a regular chart that is linked to a pivot table. When the pivot table is pivoted or updated, it may have different numbers of rows and columns, and the chart must be updated manually. Julie asked whether a procedure could be developed to update the chart automatically.
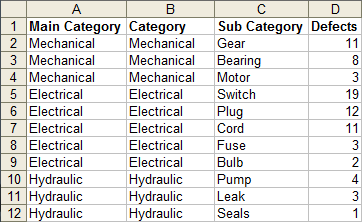
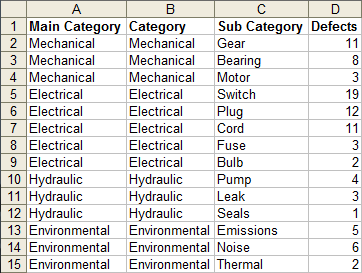
I’ve done this in a number of projects, so I thought I’d illustrate it with a simple example. Let’s start with this dummy data in a list (I’m using Excel 2003).

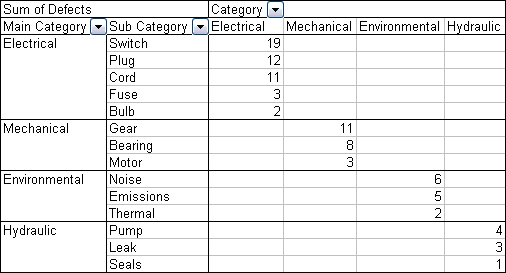
Insert a pivot table using this data. Drag the Item field to the Rows area, the Category field to the Columns area, and the Value field to the Data area. Simple enough.

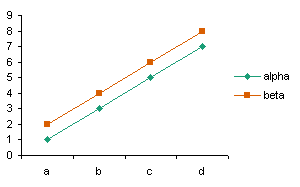
Now create a regular chart from this pivot table, using series in columns, one series per item in the Category field, Category entries (alpha and beta) as series names, and the item names as category (X) axis labels.
[Read more…] about Update Regular Chart when Pivot Table Updates


