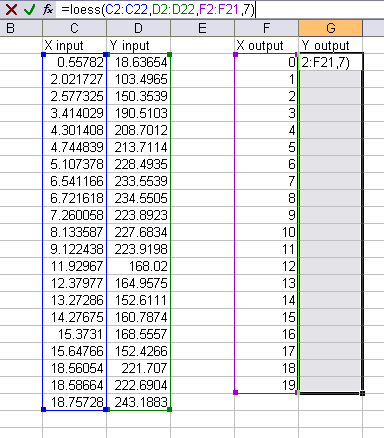
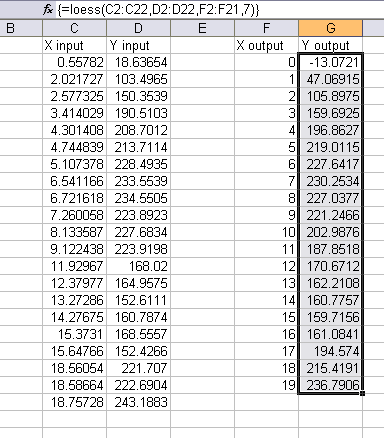
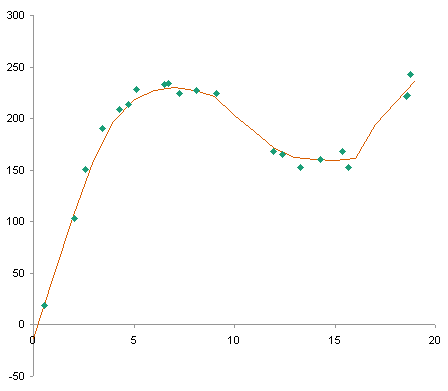
In LOESS Smoothing in Excel I described a technique for smoothing data, which essentially runs a moving weighted regression on the data set. The amount of smoothing that can be achieved without washing out the data is remarkable. In that post I showed a screen shot of a dialog of a working LOESS utility.
The LOESS utility for Excel has been updated, and the interface made more flexible. The new version is described in LOESS Utility – Awesome Update.
I’ve used this utility in-house for a while, adding little enhancements here and there. I’ve come up with three main ways to use it, illustrated in the dialog screen shots below. Based on the option selected in the top of the dialog, the mode of operation is changed.
Here the data is arranged simply, with the input X and Y in two adjacent columns, and the output Y, calculated using the input X values, placed into the third adjacent column.
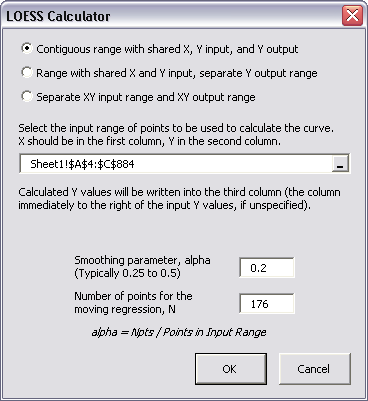
Here the input X and Y are in two columns, and the output Y is calculated using the input X values, but is located in another column. This is handy if you are calculating smoothed values for different values of alpha or N and placing the calculations in different columns.
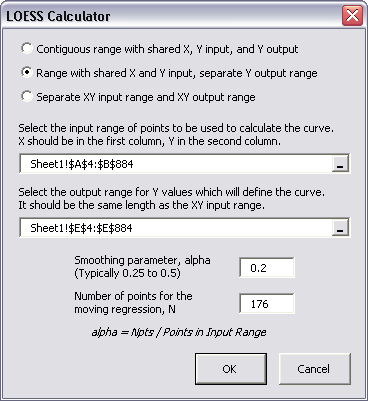
Finally, the input X and Y values are in two adjacent columns, and the output X and Y are in two other adjacent columns, not adjacent to the input columns. Here the output X values need not be the same as the input X values.

When installed, the utility places a control on the PTS Charts menu. If you haven’t installed other PTS Chart Utilities, this menu will be created first.
Compare my weight over the past three years, smoothed using a seven-day moving average…

… and using the LOESS utility. The main trends are plainly visible, while the short term fluctuations have been removed.

Update 8 October 2009
The LOESS utility for Excel has been updated, and the interface made more flexible. It is described in LOESS Utility – Awesome Update.
LOESS Smoothing in Peltier Tech Charts for Excel
I liked this utility and used it so much, that I have continued to enhance it, and I’ve included it in my commercial Excel Charting software, Peltier Tech Charts for Excel.
I’ve made numerous improvements to this utility in the seven years since I released the free demo in this article. The ones that come to mind off the top of my head:
- Data Improvement:
- Data is internally sorted by X prior to running the analysis.
- Missing data (X or Y) is ignored during the analysis.
- Algorithms are less sensitive to factors that previously caused errors (too much input at repeated X values, too few points in the analysis).
- If X output prediction range extends beyond X input data range, you can decide not to extrapolate below minimum or above maximum X values.
- Algorithm Improvement:
- You can use a moving quadratic (2nd order) regression instead of the normal 1st order regression. This is slower than the first order computation, but not as much slower as I feared.
Please visit the Peltier Tech Charts for Excel page for more information.
Articles About Regression and Trendlines on this Blog
- Trendlines and Chart Types in Excel
- Add One Trendline for Multiple Series
- Trendline Calculator for Multiple Series
- Trendline Fitting Errors
- Choosing a Trendline Type
- Plot Two Time Series and Trendlines with Different Dates
- Polynomial Fit vs. Statistical Process Control
- Moving Averages
- Stacked Column Chart with Stacked Trendlines
- Deming Regression
- Deming Regression Utility
- LOESS Smoothing in Excel
References
Cleveland, W.S. (1979), “Robust Locally Weighted Regression and Smoothing Scatterplots,” Journal of the American Statistical Association, Vol. 74, pp. 829-836.
Cleveland, W.S. and Devlin, S.J. (1988), “Locally Weighted Regression: An Approach to Regression Analysis by Local Fitting,” Journal of the American Statistical Association, Vol. 83, pp. 596-610.
NIST Engineering Statistics Handbook, 4.1.4.4. LOESS (aka LOWESS)
NIST Engineering Statistics Handbook, Example of LOESS Computations
Wikipedia, Local regression


