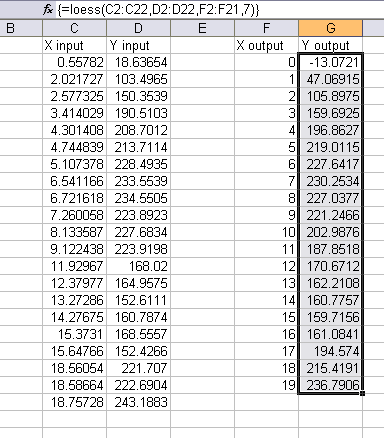
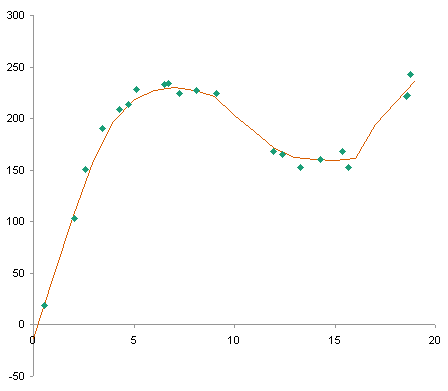
I talked about LOESS smoothing in LOESS Smoothing in Excel, where I showed my improved VBA function for calculating smoothed data. I introduced an improved LOESS Smoothing utility in LOESS Utility for Excel. Since I use the utility frequently, I encountered many things about it that I wanted to change. Since I am the developer of the utility, I have actually been able to make these changes. And after a few months of use and a few hour-long sessions aimed at making it do what I want it to do, I’ve developed this utility into something that is, in the local vernacular, “wicked awesome”. If you’ve never seen “Good Will Hunting”, that means “way cool”.
What makes this utility so great, you ask? The calculations were already perfectly adequate, and I didn’t change them at all. But I’ll show the new dialog, so you can see what has changed.
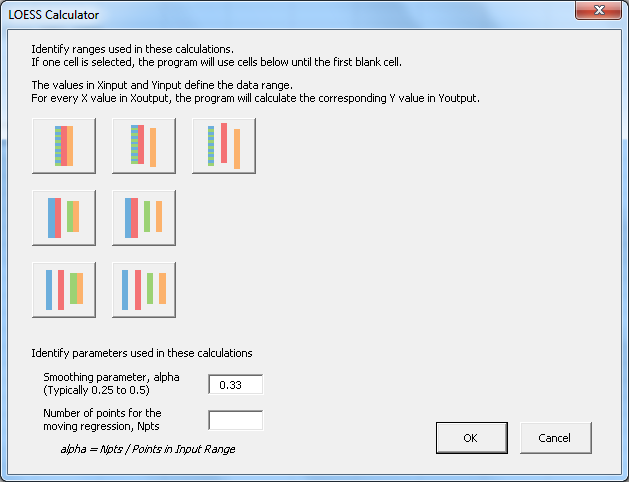
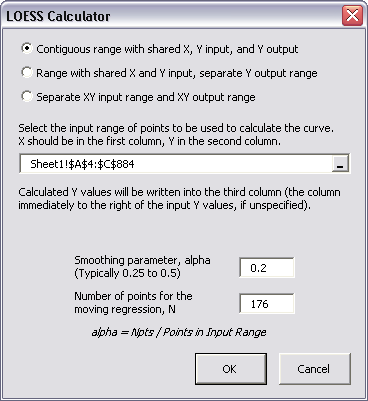
First, the previous interface for selecting input and output ranges was frustratingly restrictive. So I made the range selection function much more flexible. The colorful buttons on the left indicate the built-in options. In the most elementary case, all four entries (X input, Y input, X output, and Y output) are separate ranges, which can even be located on separate worksheets.
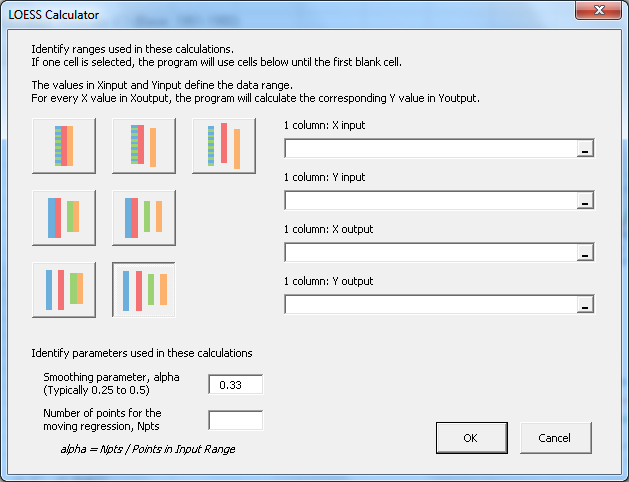
The options make range selection easier if some columns happen to be adjacent to each other, or if the same X values are to be used for both input and output. The range selection (Ref Edit) boxes and related labels update according to which option has been selected.
When the X input range has been selected, the program determines Npts, the number of points that should be used for the selected value of alpha. When the user changes alpha or Npts, the other parameter updates.
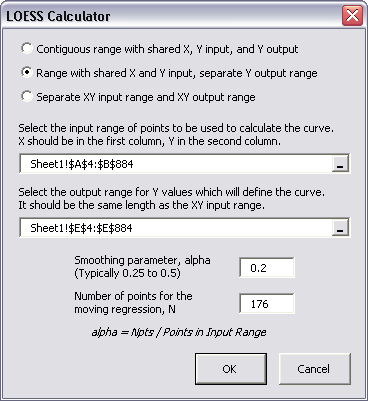
In the following case, one column serves as X input and X output (A7:A135), the adjacent column holds the Y input data (B7:B135), and the program will dump the Y output into a separate column (D7:D135).
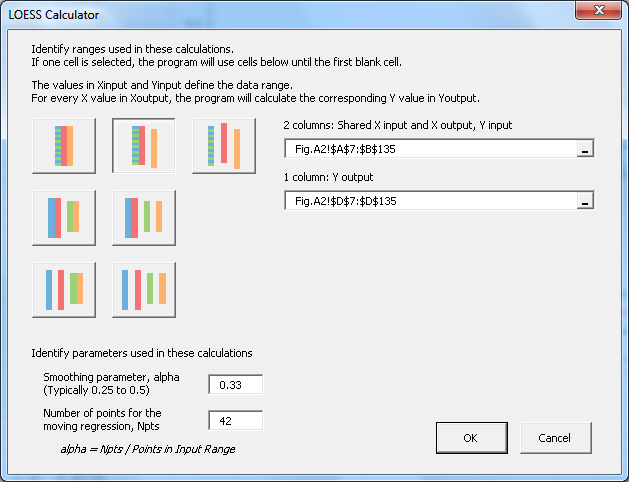
Even this wasn’t smooth enough for me, because I got tired of scrolling up and down to select long ranges. So I made another improvement. I made the program smart enough to know that if only one row had been selected, it should use the range of data below the selected row, stopping at the first empty cell.
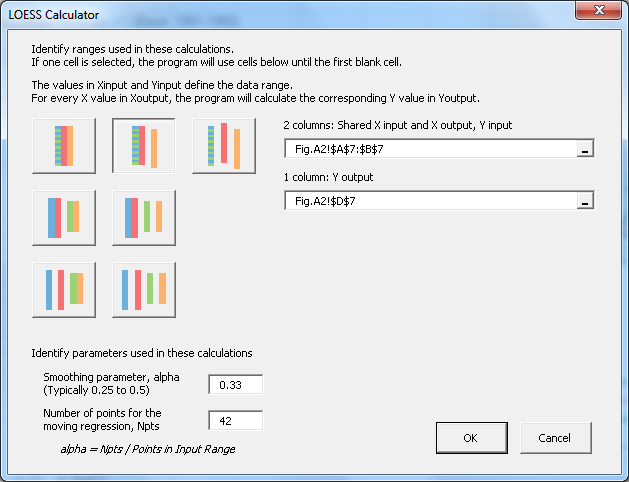
Couldn’t be easier.
The last change I made was to have the utility store the last LOESS parameters in each worksheet. This way, if I run a particular analysis on each sheet in a workbook, I only have to activate that sheet, run the program, and the dialog is pre-populated with the settings I need. What a time-saver!
PTS LOESS Utility Demo
Here is a demo of the new utility. This analysis only took a few minutes. I started with some Global Temperature Anomaly data from NASA.
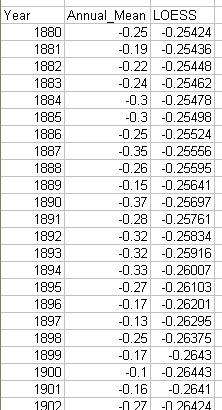
I ran the utility to generate a smoothed temperature anomaly curve.
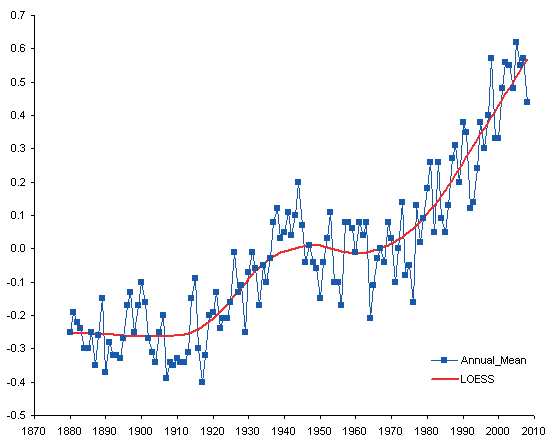
Then ran the utility a few more times to see the effect of alpha (number of points in the moving linear regression) on the shape of the smoothed curve. The values of 42, 25, and 12 points correspond to alpha values of 0.33, 0.2, and 0.1.
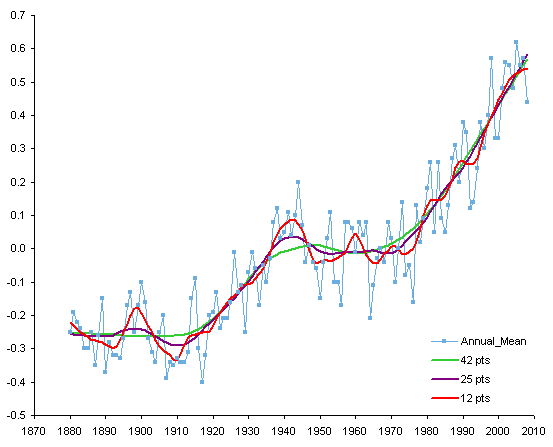
The fewer points (i.e., smaller alpha) in an analysis, the more that the smoothed curve follows local variations in the data.
What the Buttons Mean
I’ve written a companion article, LOESS Utility – What the Buttons Mean, that shows how to use the different buttons in the dialog for the various input data layouts that you may have.
Mac Users
This utility was written in 2009 for Excel 2003 for Windows. It has a button that appears on the Excel 2003 menu, and later versions of Excel for Windows place duplicate buttons on the Add-Ins tab of the ribbon. The utility was not updated for Excel 2007 and later for Windows, and no steps were taken to make it as nice in Mac Excel.
During installation, Mac Excel 2011 ignores the code that produces these buttons, while Mac Excel 2016 displays two error messages saying Run-time error 5: Invalid procedure call or argument. Despite this, the add-in can still be used in Excel for Mac.
Installation
In Mac Excel 2011, go to the Tools menu > Add-Ins, click the Select… button, navigate to the PTS_LOESS.xla file, then click OK to return to Excel.
In Mac Excel 2016, go to the Tools menu > Add-Ins or click the Excel Add-Ins button on the Developer tab of the ribbon, click the Browse… button, navigate to the PTS_LOESS.xla file, then click OK to return to Excel.
Running the Utility
Because the interface elements do not appear in either version of Mac Excel, you need to run the VBA procedure by name.
In Mac 2011, go to the Tools menu > Macro > Macros…, enter LoessDialog as the name of the macro, and click Run.
In Mac 2016, go to the Tools menu > Macro > Macros… or click the Macros button on the Developer tab of the ribbon, enter LoessDialog as the name of the macro, and click Run.
Dialog Size and Appearance
Since Windows uses points as its main unit of measure while Mac uses pixels, the dialogs are shrunken by 25% on the Mac (a pixel is only 75% as large as a point). The dialog color on the Mac is a very drab gray, and the buttons and other controls are unattractive.
When the dialog first appears in Mac Excel 2011, it looks like this. The icons are missing from the buttons (another Windows-Mac-Excel-VBA incompatibility), and the various textboxes which match the dialog background in Windows are much lighter on the Mac. You will need to refer to my article LOESS Utility – What the Buttons Mean to see which button is which.
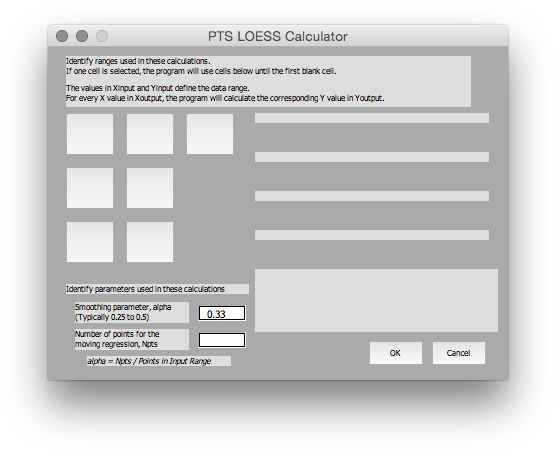
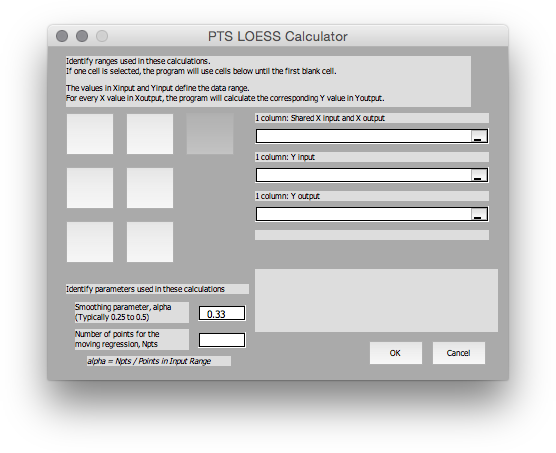
You can tell which button has been clicked (button 3 below) and you can easily tell which data entry boxes are available.
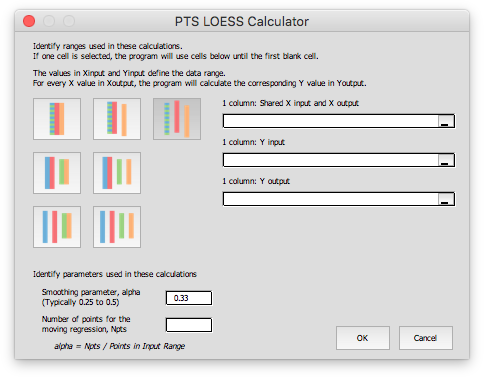
The dialog color isn’t as drab in Mac Excel 2016, the textboxes match in color, and the button icons are all visible.
LOESS Smoothing in Peltier Tech Charts for Excel
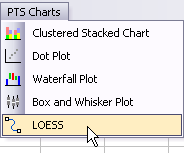
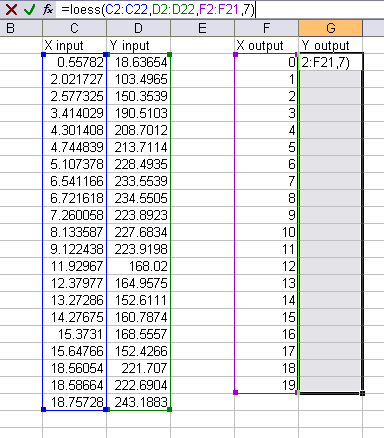
I liked this utility and used it so much, that I’ve included an enhanced version in my commercial Excel Charting software, Peltier Tech Charts for Excel .
Dialog Appearance
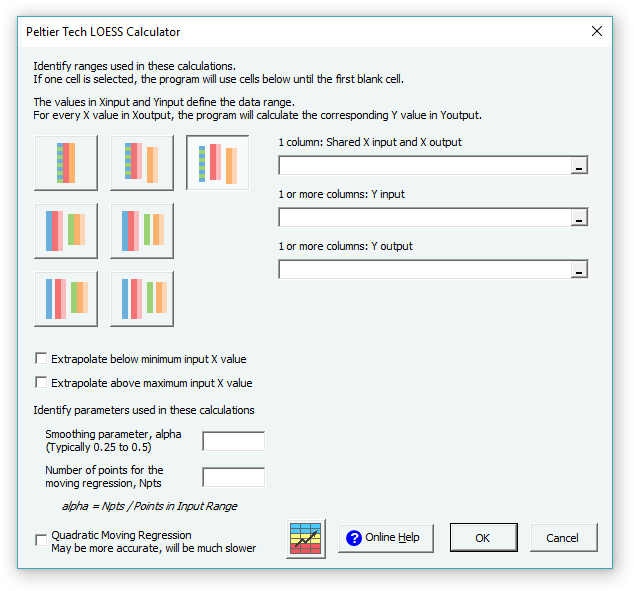
Here’s the dialog in Excel for Windows (Excel 2007 to 2016 shown in Windows 10).
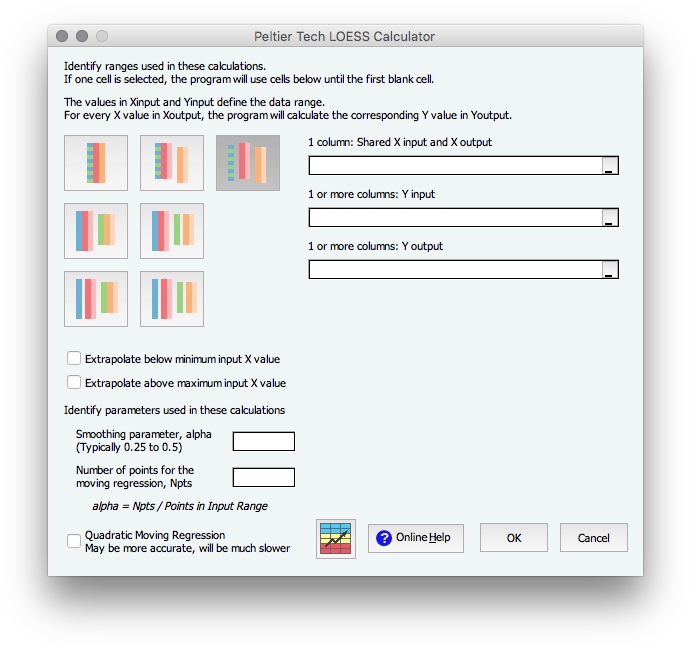
Here’s the dialog in Excel 2011 for Mac.
And Here’s the dialog in Excel 2016 for Mac.
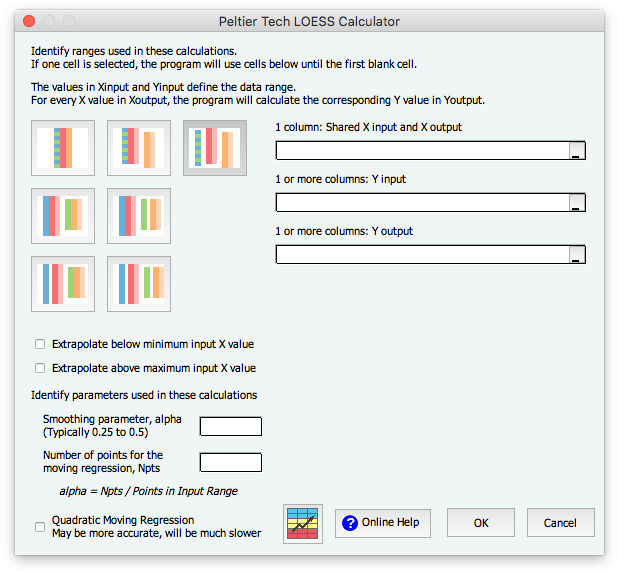
The dialogs look substantially the same and work exactly the same in all of these versions.
Enhancements
I’ve made numerous improvements to this utility in the seven years since I released the free demo in this article. The ones that come to mind off the top of my head:
- Data Improvement:
- Data is internally sorted by X prior to running the analysis.
- Missing data (X or Y) is ignored during the analysis.
- Algorithms are less sensitive to factors that previously caused errors (too much input at repeated X values, too few points in the analysis).
- If X output prediction range extends beyond X input data range, you can decide not to extrapolate below minimum or above maximum X values.
- Algorithm Improvement:
- You can use a moving quadratic (2nd order) regression instead of the normal 1st order regression. This is slower than the first order computation, but not as much slower as I feared.
Please visit the Peltier Tech Charts for Excel page for more information.
References
Cleveland, W.S. (1979), “Robust Locally Weighted Regression and Smoothing Scatterplots,” Journal of the American Statistical Association, Vol. 74, pp. 829-836.
Cleveland, W.S. and Devlin, S.J. (1988), “Locally Weighted Regression: An Approach to Regression Analysis by Local Fitting,” Journal of the American Statistical Association, Vol. 83, pp. 596-610.
NIST Engineering Statistics Handbook, 4.1.4.4. LOESS (aka LOWESS)
NIST Engineering Statistics Handbook, Example of LOESS Computations
Wikipedia, Local regression


