Pie Chart Data Labels
I’ve never been completely satisfied with Excel’s pie chart data label options. Below I’ve used the Outside End and Inside End options for data label positions. The problem with Outside End labels is that the pie is shrunken somewhat to make room for labels outside of the pie. And it’s not perfect, because the long “Turquoise” label extends slightly into the pie. The Outside End labels allow for a full-size pie, but some of these labels may still extend outside of the pie.
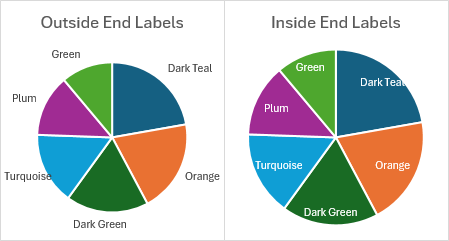
The Outside End labels use the default dark gray text, and they have great contrast with the white chart background. I changed the labels to white text for the Inside End labels, and they have good contrast against the fill colors; in fact, the new theme Microsoft rolled out in 2024 was designed so that white labels had good contrast against all of its colors. (I have trouble distinguishing the dark teal and dark green colors in some charts, but that’s a different issue.)
Improving the Label Formatting
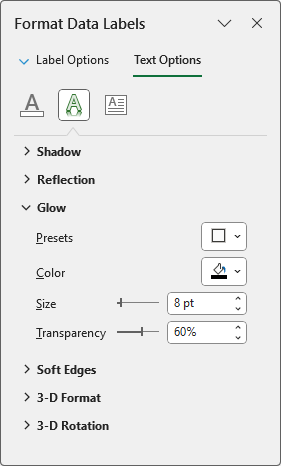
One way to improve on the white labels is to add a glow effect. I usually shy away from special effects, especially on data elements in a chart. But if you add a dark semitransparent glow to white text labels, they pop even better against the pie chart’s fill colors, and any bit of label that overhangs into the white background can still be read.
Here are the glow settings I use: an 8-point-wide black glow, with 60% transparency.
Finding a Better Label Position
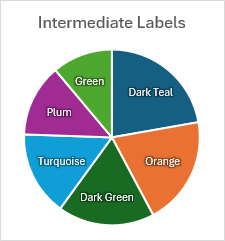
Below are labels in the Inside End and Center positions, with the glow applied. To me, the white labels with a dark glow really stand out on the colored data points.
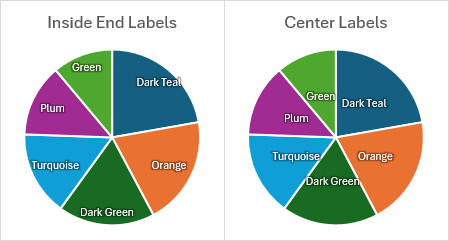
The Inside End labels look like they’re too close to the edge of the pie, with some labels butting up against the edge, and at least one overhanging. The Center labels, on the other hand, are too close to the center of the pie. I think the labels, which are in an intermediate position, below look better.
VBA to Apply the Intermediate Data Label Position
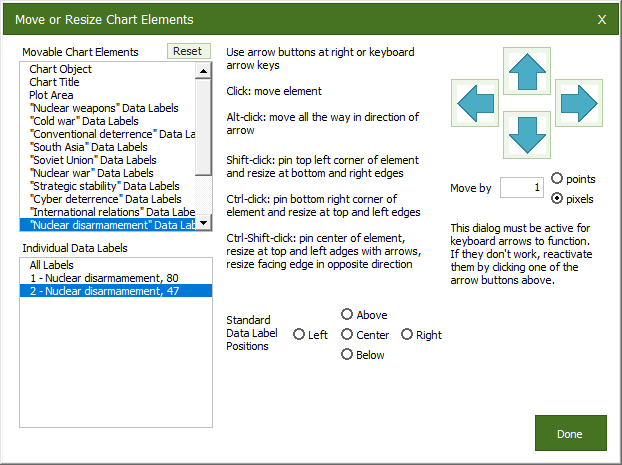
I wrote a simple VBA routine to apply my preferred labels. For each label, it applies the Inside End position, measures the Left and Top properties of the label, then applies the Center position and again measures Left and Top, takes the average of the Left and Top measurements, and applies them to the label.
Sub IntermediatePieChartDataLabels()
  If Not ActiveChart Is Nothing Then
    If ActiveChart.ChartType = xlPie Then
      Dim srs As Series
      Set srs = ActiveChart.SeriesCollection(1)
      If srs.HasDataLabels Then
        ' set position to Inside End or Center to maximize Plot Area size
        srs.DataLabels.Position = xlLabelPositionInsideEnd
        Dim iPt As Long
        For iPt = 1 To srs.Points.Count
          If srs.Points(iPt).HasDataLabel Then
            Dim lbl As DataLabel
            Set lbl = srs.Points(iPt).DataLabel

            lbl.Position = xlLabelPositionInsideEnd
            Dim InsideEnd(1 To 2) As Double
            InsideEnd(1) = lbl.Left
            InsideEnd(2) = lbl.Top

            lbl.Position = xlLabelPositionCenter
            Dim Center(1 To 2) As Double
            Center(1) = lbl.Left
            Center(2) = lbl.Top

            Dim NewLeft As Double, NewTop As Double
            NewLeft = (InsideEnd(1) + Center(1)) / 2
            NewTop = (InsideEnd(2) + Center(2)) / 2
            lbl.Left = NewLeft
            lbl.Top = NewTop

          End If
        Next
      End If
    End If
  End If
End Sub
When I first run a new routine, I step through to watch it as it makes the changes. I was pleased that the result was a chart with the nice intermediate labels shown above.
Problem with the VBA Procedure
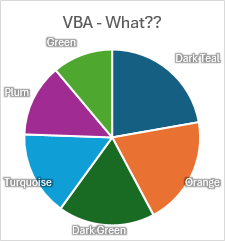
The next test is to run the code at full speed from the top. And one of two things would happen: either no labels changed position, or all labels changed position to a pseudo-Outside-End appearance shown below. It’s not really Outside End, since the pie didn’t shrink to make room for the labels, but the labels were all outside the chart.
Fixing the VBA Procedure
This kind of problem is common when working with Excel charts. When you make a change, such as changing the data label position, it takes a short time to move the label. But the command after the change, such as measuring the new position, executes before the data label has moved to its new position. This means the new calculated position of the label will be wrong.
To get around this, the usual approach is to insert a DoEvents command, sometimes more than once. This causes the VBA to pause for a moment and let the computer finish taking care of modifying objects and properties, such as the label position. I placed DoEvents in a loop, and introduced a long variable nRep to control the number of times the loop will run. Here is the updated procedure:
Sub IntermediatePieChartDataLabels()
Const nRep As Long = 5
If Not ActiveChart Is Nothing Then
If ActiveChart.ChartType = xlPie Then
Dim srs As Series
Set srs = ActiveChart.SeriesCollection(1)
If srs.HasDataLabels Then
' set position to Inside End or Center to maximize Plot Area size
srs.DataLabels.Position = xlLabelPositionInsideEnd
Dim iPt As Long
For iPt = 1 To srs.Points.Count
If srs.Points(iPt).HasDataLabel Then
Dim lbl As DataLabel
Set lbl = srs.Points(iPt).DataLabel
lbl.Position = xlLabelPositionInsideEnd
Dim iRep As Long
For iRep = 1 To nRep
' label repositioning is slower than getting label position
DoEvents
Next
Dim InsideEnd(1 To 2) As Double
InsideEnd(1) = lbl.Left
InsideEnd(2) = lbl.Top
lbl.Position = xlLabelPositionCenter
For iRep = 1 To nRep
' label repositioning is slower than getting label position
DoEvents
Next
Dim Center(1 To 2) As Double
Center(1) = lbl.Left
Center(2) = lbl.Top
Dim NewLeft As Double, NewTop As Double
NewLeft = (InsideEnd(1) + Center(1)) / 2
NewTop = (InsideEnd(2) + Center(2)) / 2
lbl.Left = NewLeft
lbl.Top = NewTop
End If
Next
End If
End If
End If
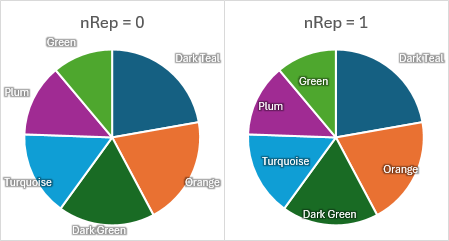
End SubTo test this, I ran the new procedure with values of nRep between 0 and 5.
When nRep = 0, nothing worked as expected (below left). When nRep = 1, at least one label was in the broken pseudo-Outside-End position, while one or more labels may have found the desired Intermediate position (below right). The results were not always the same; the same label might end up in a different position each time the code was run.
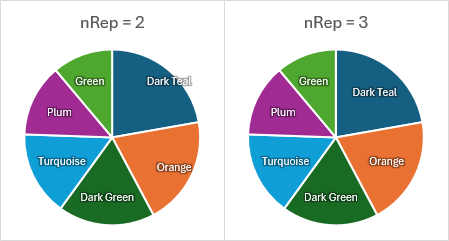
When nRep = 2, most of the labels ended up in the Intermediate position, but one or more did not (below left). Finally, when nRep was 3 or greater, all labels were properly positioned (below right).
The final version of my code uses a value of 5 for nRep.
More About Data Labels on this Website
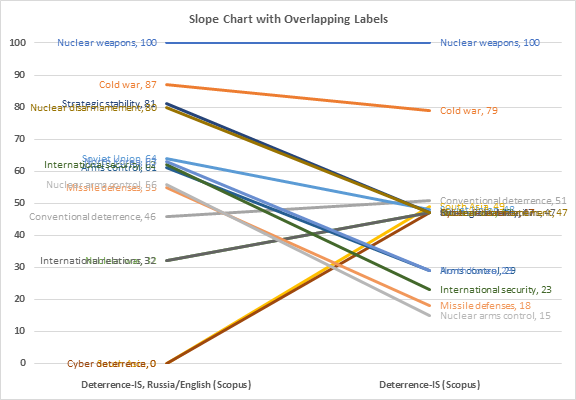
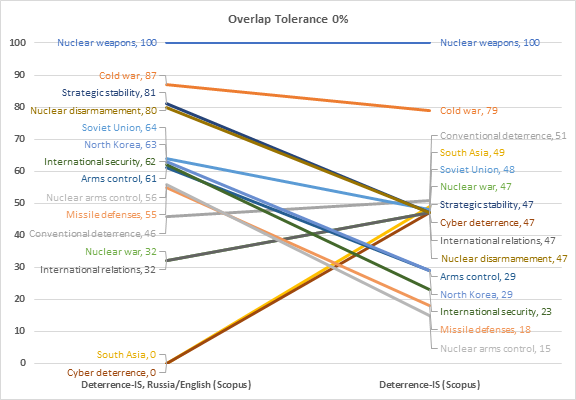
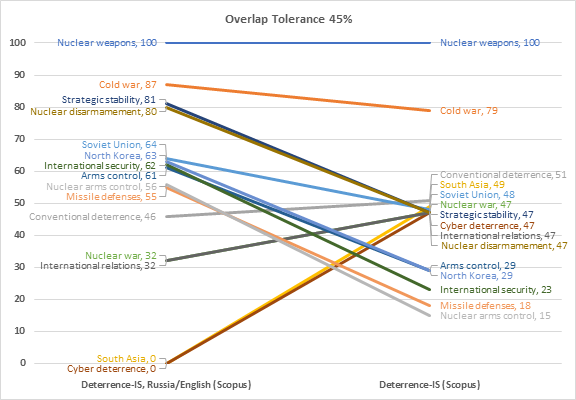
- Slope Chart with Data Labels
- Prevent Overlapping Data Labels in Excel Charts
- Apply Custom Data Labels to Charted Points
- Label Each Series in a Chart
- Label Last Point for Excel 2007
- Add Totals to Stacked Bar Chart
- Custom Axis Labels and Gridlines in an Excel Chart
- Text Labels on a Horizontal Bar Chart in Excel