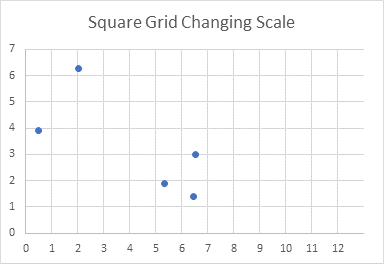
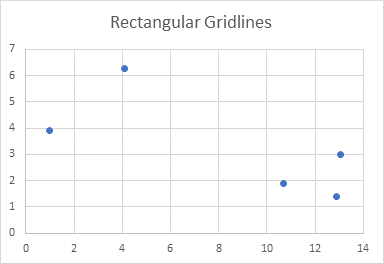
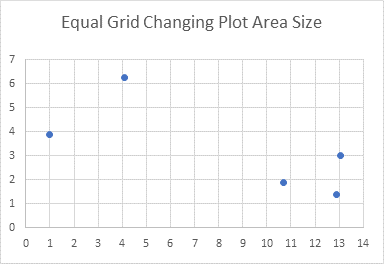
Excel does a pretty good job of scaling its chart axes. But there are times when you wish it would do a better job. One case is shown in XY Scatter chart below. All of the points have X and Y values between 0 and 7, but because the chart itself is rectangular, the gridlines are spaced differently along the X and Y axes. Wouldn’t it be nicer if the spacing was the same along both axes, giving you square gridlines?

There are a few ways to accomplish this, not including the tedious manual method of clicking and dragging with the mouse or trying a sequence of values for the axis maximums to try to make it work out. I’ll use VBA to handle this task.
Square Gridlines by Changing Axis Scales
The first approach works by measuring the chart’s plot area dimensions, locking in the axis scale parameters, and using the scale to determine how far apart the gridlines are horizontally and vertically. Then the axis which has the larger spacing has its maximum increased so its gridline spacing shrinks to match the spacing on the perpendicular axis.
I wrote this function: pass in the chart you want to be squared up, and the function does its job.
Function SquareGridChangingScale(myChart As Chart)
  With myChart
    ' get plot size
    With .PlotArea
      Dim plotInHt As Double, plotInWd As Double
      plotInHt = .InsideHeight
      plotInWd = .InsideWidth
    End With

    ' Get axis scale parameters and lock scales
    With .Axes(xlValue)
      Dim Ymax As Double, Ymin As Double, Ymaj As Double
      Ymax = .MaximumScale
      Ymin = .MinimumScale
      Ymaj = .MajorUnit
      .MaximumScaleIsAuto = False
      .MinimumScaleIsAuto = False
      .MajorUnitIsAuto = False
    End With

    With .Axes(xlCategory)
      Dim Xmax As Double, Xmin As Double, Xmaj As Double
      Xmax = .MaximumScale
      Xmin = .MinimumScale
      Xmaj = .MajorUnit
      .MaximumScaleIsAuto = False
      .MinimumScaleIsAuto = False
      .MajorUnitIsAuto = False
    End With

    ' Tick spacing (distance)
    Dim Ytic As Double, Xtic As Double
    Ytic = plotInHt * Ymaj / (Ymax - Ymin)
    Xtic = plotInWd * Xmaj / (Xmax - Xmin)

    ' Keep plot size as is, adjust max scales
    If Xtic > Ytic Then
      .Axes(xlCategory).MaximumScale = plotInWd * Xmaj / Ytic + Xmin
    Else
      .Axes(xlValue).MaximumScale = plotInHt * Ymaj / Xtic + Ymin
    End If
  End With
End Function
I’ll describe several ways to call this function later, but for now, this line of code should be fine, either in your own sub or just in the Immediate Window:
SquareGridChangingScale ActiveChartThe squared-up chart is shown below. The gridlines are square, accomplished by changing the X-axis maximum to 12.9777. Good thing we have VBA to calculate this for us.
There is a strange blank edge to the chart, but you could make it look less strange by formatting the plot area border to match the axes.

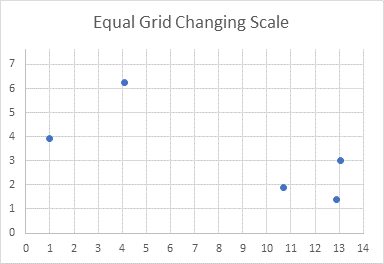
Let’s try with another chart. This is like the first, but the X values are twice as large as before, leading to a different scale.
This is the resulting chart. Again, the gridlines are square and the right edge looks blank. But we see another problem. The X-axis tick spacings are 2 units apart, compared to the Y-axis with its 1 unit spacing.

Force Equal Major Unit Spacing
I’ll modify my earlier procedure by adding an optional argument EqualMajorUnit. If this is True, the code will apply the same spacing to both axes before adjusting the axis maximum values. If it is False or omitted, the code will ignore tick spacing.
Function SquareGridChangingScale(myChart As Chart, Optional EqualMajorUnit As Boolean = False)
  With myChart
    ' get plot size
    With .PlotArea
      Dim plotInHt As Double, plotInWd As Double
      plotInHt = .InsideHeight
      plotInWd = .InsideWidth
    End With

    ' Get axis scale parameters and lock scales
    With .Axes(xlValue)
      Dim Ymax As Double, Ymin As Double, Ymaj As Double
      Ymax = .MaximumScale
      Ymin = .MinimumScale
      Ymaj = .MajorUnit
      .MaximumScaleIsAuto = False
      .MinimumScaleIsAuto = False
      .MajorUnitIsAuto = False
    End With

    With .Axes(xlCategory)
      Dim Xmax As Double, Xmin As Double, Xmaj As Double
      Xmax = .MaximumScale
      Xmin = .MinimumScale
      Xmaj = .MajorUnit
      .MaximumScaleIsAuto = False
      .MinimumScaleIsAuto = False
      .MajorUnitIsAuto = False
    End With

    If EqualMajorUnit Then
      ' Set tick spacings to same value
      Xmaj = WorksheetFunction.Min(Xmaj, Ymaj)
      Ymaj = Xmaj
      .Axes(xlCategory).MajorUnit = Xmaj
      .Axes(xlValue).MajorUnit = Ymaj
    End If

    ' Tick spacing (distance)
    Dim Ytic As Double, Xtic As Double
    Ytic = plotInHt * Ymaj / (Ymax - Ymin)
    Xtic = plotInWd * Xmaj / (Xmax - Xmin)

    ' Keep plot size as is, adjust max scales
    If Xtic > Ytic Then
      .Axes(xlCategory).MaximumScale = plotInWd * Xmaj / Ytic + Xmin
    Else
      .Axes(xlValue).MaximumScale = plotInHt * Ymaj / Xtic + Ymin
    End If
  End With
End Function
Here is our chart after running the second version of the function.
That’s better, the grids are square and have equal spacing. Now the unfinished edge is along the top of the chart. Again, matching the plot area line color to the axes makes it look less awkward.

Square Gridlines by Changing Plot Area Size
We achieved square gridlines above by keeping the plot area fixed and adjusting the axis scales. But what if we shrink the plot area by the amount needed to square up the gridlines? We’ll get blank space along the edge of the chart without some gridlines hanging off in space, and we can then center the plot area within the chart.
Here’s the new function. Note that I’ve kept the EqualMajorUnit argument.
Function SquareGridChangingPlotSize(myChart As Chart, Optional EqualMajorUnit As Boolean = False)
With myChart
' get plot size
With .PlotArea
Dim plotInHt As Double, plotInWd As Double
plotInHt = .InsideHeight
plotInWd = .InsideWidth
End With
' Get axis scale parameters and lock scales
With .Axes(xlValue)
Dim Ymax As Double, Ymin As Double, Ymaj As Double
Ymax = .MaximumScale
Ymin = .MinimumScale
Ymaj = .MajorUnit
.MaximumScaleIsAuto = False
.MinimumScaleIsAuto = False
.MajorUnitIsAuto = False
End With
With .Axes(xlCategory)
Dim Xmax As Double, Xmin As Double, Xmaj As Double
Xmax = .MaximumScale
Xmin = .MinimumScale
Xmaj = .MajorUnit
.MaximumScaleIsAuto = False
.MinimumScaleIsAuto = False
.MajorUnitIsAuto = False
End With
If EqualMajorUnit Then
' Set tick spacings to same value
Xmaj = WorksheetFunction.Min(Xmaj, Ymaj)
Ymaj = Xmaj
.Axes(xlCategory).MajorUnit = Xmaj
.Axes(xlValue).MajorUnit = Ymaj
End If
' Tick spacing (distance)
Dim Ytic As Double, Xtic As Double
Ytic = plotInHt * Ymaj / (Ymax - Ymin)
Xtic = plotInWd * Xmaj / (Xmax - Xmin)
' Adjust plot area size, center within space
If Xtic < Ytic Then
.PlotArea.InsideHeight = .PlotArea.InsideHeight * Xtic / Ytic
.PlotArea.Top = .PlotArea.Top + _
(.ChartArea.Height - .PlotArea.Height - .PlotArea.Top) / 2
Else
.PlotArea.InsideWidth = .PlotArea.InsideWidth * Ytic / Xtic
.PlotArea.Left = .PlotArea.Left + _
(.ChartArea.Width - .PlotArea.Width - .PlotArea.Left) / 2
End If
End With
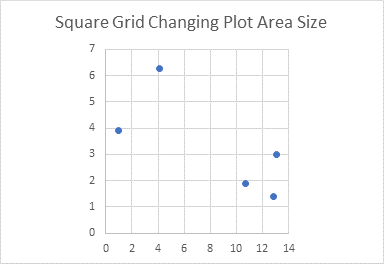
End FunctionWhen we run this code, we get square gridlines with no funny gridline extensions and no large blank areas in the chart. The plot area is nicely centered.

This is much better than the first approach. Let’s see how it works with the other data.
Okay, we forgot to use EqualMajorUnit = True, so the square grid has different tick spacing on the X and Y axes. Let’s try again.
Yes, this second function is a major improvement over the first. It may even be better to set the default value of EqualMajorUnit to True.
Square Gridlines by Changing Chart Size
When the second function resized the plot area, we ended up with a bit of white space in the resulting chart. In some cases, this amount of white space was substantial. What if we shrink the whole chart, not just the plot area, and absorb the excess white space?
Function SquareGridChangingChartSize(myChart As Chart, Optional EqualMajorUnit As Boolean = False)
  With myChart
    ' get plot size
    With .PlotArea
      Dim plotInHt As Double, plotInWd As Double
      plotInHt = .InsideHeight
      plotInWd = .InsideWidth
    End With

    ' Get axis scale parameters and lock scales
    With .Axes(xlValue)
      Dim Ymax As Double, Ymin As Double, Ymaj As Double
      Ymax = .MaximumScale
      Ymin = .MinimumScale
      Ymaj = .MajorUnit
      .MaximumScaleIsAuto = False
      .MinimumScaleIsAuto = False
      .MajorUnitIsAuto = False
    End With

    With .Axes(xlCategory)
      Dim Xmax As Double, Xmin As Double, Xmaj As Double
      Xmax = .MaximumScale
      Xmin = .MinimumScale
      Xmaj = .MajorUnit
      .MaximumScaleIsAuto = False
      .MinimumScaleIsAuto = False
      .MajorUnitIsAuto = False
    End With

    If EqualMajorUnit Then
      ' Set tick spacings to same value
      Xmaj = WorksheetFunction.Min(Xmaj, Ymaj)
      Ymaj = Xmaj
      .Axes(xlCategory).MajorUnit = Xmaj
      .Axes(xlValue).MajorUnit = Ymaj
    End If

    ' Tick spacing (distance)
    Dim Ytic As Double, Xtic As Double
    Ytic = plotInHt * Ymaj / (Ymax - Ymin)
    Xtic = plotInWd * Xmaj / (Xmax - Xmin)

    ' Adjust chart size
    If Xtic < Ytic Then
      .Parent.Height = .Parent.Height - .PlotArea.InsideHeight * (1 - Xtic / Ytic)
    Else
      .Parent.Width = .Parent.Width - .PlotArea.InsideWidth * (1 - Ytic / Xtic)
    End If

  End With
End Function
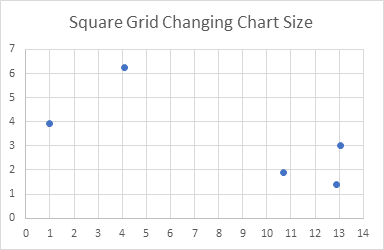
Some caveats apply to this approach. When you resize the chart, the chart title may decide it needs a line break, which will change the plot area size, and make the gridlines not square. Here are the results of our charts from the two data sets, without fixing the tick spacing mismatch of the second data set.
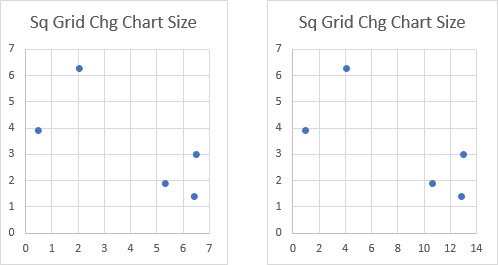
Here is the chart for the second data set, with EqualMajorUnit set to True.
Square Gridlines by Changing Chart Size
The only way to improve my functions is to ignore the first and combine the last two, passing in the parameter ShrinkChart which tells the function whether to adjust the plot area (if False) or chart size (if True).
Function SquareXYChartGrid(myChart As Chart, ShrinkChart As Boolean, _
    Optional EqualMajorUnit As Boolean = False)

  With myChart
    ' get plot size
    With .PlotArea
      Dim plotInHt As Double, plotInWd As Double
      plotInHt = .InsideHeight
      plotInWd = .InsideWidth
    End With

    ' Get axis scale parameters and lock scales
    With .Axes(xlValue)
      Dim Ymax As Double, Ymin As Double, Ymaj As Double
      Ymax = .MaximumScale
      Ymin = .MinimumScale
      Ymaj = .MajorUnit
      .MaximumScaleIsAuto = False
      .MinimumScaleIsAuto = False
      .MajorUnitIsAuto = False
    End With

    With .Axes(xlCategory)
      Dim Xmax As Double, Xmin As Double, Xmaj As Double
      Xmax = .MaximumScale
      Xmin = .MinimumScale
      Xmaj = .MajorUnit
      .MaximumScaleIsAuto = False
      .MinimumScaleIsAuto = False
      .MajorUnitIsAuto = False
    End With

    If EqualMajorUnit Then
      ' Set tick spacings to same value
      Xmaj = WorksheetFunction.Min(Xmaj, Ymaj)
      Ymaj = Xmaj
      .Axes(xlCategory).MajorUnit = Xmaj
      .Axes(xlValue).MajorUnit = Ymaj
    End If

    ' Tick spacing (distance)
    Dim Ytic As Double, Xtic As Double
    Ytic = plotInHt * Ymaj / (Ymax - Ymin)
    Xtic = plotInWd * Xmaj / (Xmax - Xmin)

    If ShrinkChart Then
      ' Adjust chart size
      If Xtic < Ytic Then
        .Parent.Height = .Parent.Height - .PlotArea.InsideHeight * (1 - Xtic / Ytic)
      Else
        .Parent.Width = .Parent.Width - .PlotArea.InsideWidth * (1 - Ytic / Xtic)
      End If

    Else
      ' Adjust plot area size, center within space
      If Xtic < Ytic Then
        .PlotArea.InsideHeight = .PlotArea.InsideHeight * Xtic / Ytic
        .PlotArea.Top = .PlotArea.Top + _
          (.ChartArea.Height - .PlotArea.Height - .PlotArea.Top) / 2
      Else
        .PlotArea.InsideWidth = .PlotArea.InsideWidth * Ytic / Xtic
        .PlotArea.Left = .PlotArea.Left + _
          (.ChartArea.Width - .PlotArea.Width - .PlotArea.Left) / 2
      End If
    End If

  End With
End Function
Here is how you might call the function from one Sub, which determines which charts were selected and applies the function to each.
Sub SquareXYGridOfSelectedCharts()
  If Not ActiveChart Is Nothing Then
    SquareXYChartGrid ActiveChart, True, True

  ElseIf TypeName(Selection) = "DrawingObjects" Then
    Dim shp As Shape
    For Each shp In Selection.ShapeRange
      If shp.HasChart Then
        SquareXYChartGrid shp.Chart, True, True
      End If
    Next

  Else
    MsgBox "Select one or more charts and try again.", vbExclamation, "No Chart Selected"
  End If
End Sub
Articles about Axis Scales on Peltier Tech Blog
- Calculate Nice Axis Scales with LET and LAMBDA
- Calculate Nice Axis Scales in Your Excel Worksheet
- Calculate Nice Axis Scales in Excel VBA
- Chart UDF to Control Axis Scale
- How Excel Calculates Automatic Chart Axis Limits
- Reciprocal Chart Axis Scale
- Custom Axis Labels and Gridlines in an Excel Chart
- Custom Axis, Y = 1, 2, 4, 8, 16
- Logarithmic Axis Scales
- Link Excel Chart Axis Scale to Values in Cells
- Consistent Axis Scales Across Multiple Charts
- Gantt Chart with Nice Date Axis
- Select Meaningful Axis Scales
- Bar Chart Value Axis Scale Must Include Zero
- Text Labels on a Horizontal Bar Chart in Excel


Leave a Reply