Linear Regression
People are familiar with a standard linear regression (LR) method that makes assumptions about the X and Y variables in the analysis. Excel’s built-in regression methods make these same assumptions.
The X variable, also called the independent variable, is assumed to be known precisely, and all error in the regression is assumed to be in the measurement of the Y variable, the dependent variable.
This assumption is reasonable enough. But there are cases where errors in the values of X cannot be discounted. For example, X and Y may be comparisons of the output of two different machines for given inputs. When the outputs are compared, both machines are subject to errors in measurement, so the usual assumptions are invalid.
Deming Regression Example
Suppose Machines A and B had the following output. At each nominal output value, the results of two runs of each machine are tabulated. There is some variability in measurements of each machine’s output. The averages of each machine at each nominal output level are shown next to the individual measurements.
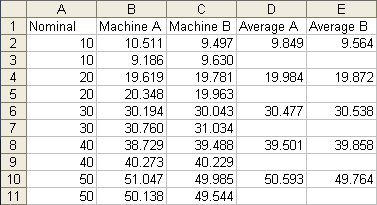
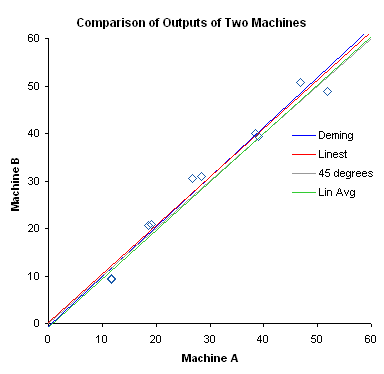
We may be tempted to plot each machine’s outputs as Y values against the nominal X values.
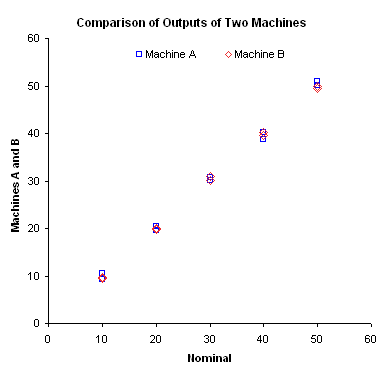
We may even compute the lines of best fit for the two machines. We can see that they are close, but not exactly the same. The problem with this analysis is that we are not directly regressing one machine against the other.
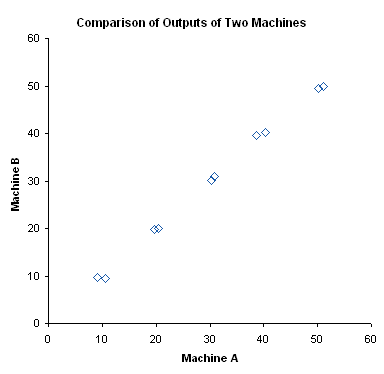
In the Deming Regression, outputs of the two machines are plotted against each other. Pairs of actual outputs are measured for each nominal output, and the differences between the two measurements from each machine will be used to estimate the variation of each machine’s outputs. The averages of each pair form the basis of the regression, corrected for the machine variation.
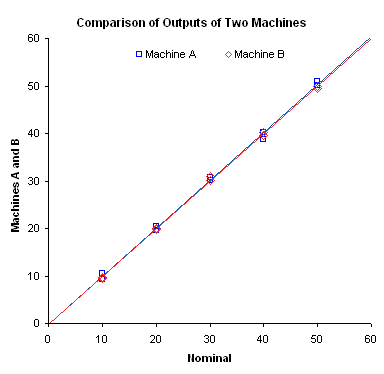
The table below shows three sets of calculations. The first row shows a standard linear regression of the measured data. The second row shows a standard linear regression performed on the averages of each pair of values. The third shows the Deming regression analysis. Details of the Deming regression calculations are not given here, but a motivated reader can check the links in the references at the end of this article.
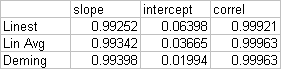
The data are not too different, and in fact the correlation in the LR of the average values and of the Deming regression are identical. In the plot below, lines have been added to show the three sets of results in the table above, as well as the 45 degree line, where Machine B = Machine A. The lines are practically on top of each other.
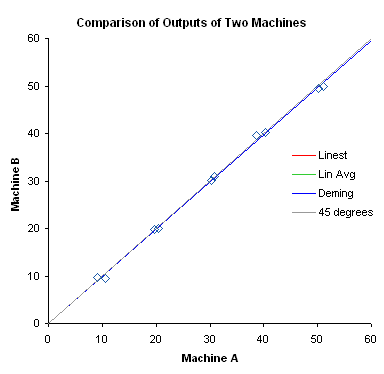
In the example above, there is little difference in the output of the various LR models. However, if Machines A and B exhibit greater variation in their output, there can be noticeable differences.
Deming Regression Utility
I’ve created a small utility that facilitates Deming Regression analysis in Excel. Read about it and follow the download link in Deming Regression Utility.
Regression and Trendline Articles in this Blog
- Trendlines and Chart Types in Excel
- Add One Trendline for Multiple Series
- Trendline Calculator for Multiple Series
- Trendline Fitting Errors
- Choosing a Trendline Type
- Plot Two Time Series and Trendlines with Different Dates
- Polynomial Fit vs. Statistical Process Control
- Moving Averages
- Stacked Column Chart with Stacked Trendlines
- Deming Regression Utility
- LOESS Smoothing in Excel
- LOESS Utility for Excel
References
Chapter 17: Creating Custom Functions, Excel for Chemists: A Comprehensive Guide, 2nd Edition. by E. Joseph Billo, Copyright 2001 by John Wiley & Sons, Inc.
Incorrect Least-Squares Regression Coefficients in Method-Comparison Analysis by P. Joanne Cornbleet and Nathan Gochman, Clin. Chem. 25/3, 432-438 (1979).


Jan Karel Pieterse says
Nice post Jon.
As a (former) process engineer I can relate to subjects like this one.
Of course if you’d want to do this research properly (no pun intended), you’d set up an experiment using Design of Experiments, factoring in the machine as a qualitative variable in the design.
jeff weir says
Hi Jon. I was initially uncertain how regression analysis would be relevant in your example above of the regression of one machine output on another…I didn’t think there was a dependent variable i.e. how would the output of one machine (your Y value) be dependent on the output of another (your X value) given that these machines are independent from one another.
However, after a bit of internet reading, I see that Deming Regression is often used to evaluate a manufacturer’s claims regarding a product, or to judge acceptability of say different clinical chemistry methods.
You learn something every post, as the saying goes…
DaleW says
Hi, Jon. When I used this somewhat more robust linear regression technique it was going by the name of orthogonal regression, which I now see is a superset of two variable linear Deming regression. Your example is a special case where X and Y might be expected to have similar values in the same units, but of course Deming regression can be handy whenever BOTH X and Y are known to have significant measurement error, and we want to estimate the underlying linear relationship.
Anyway, I’d downloaded and modified and stashed away a workbook from 2005 by sj00 that performed this using VBA, but it would trust the coding and documentation of the PTS version much more. Thanks for bringing more numerical methods to Excel!
Jon Peltier says
Jeff – I guess the test would be to use machine A as X and machine B as Y and do the analysis, then reverse the machines and repeat it. I actually looked at it as two variables which were dependent on independent variables which are not shown in the analysis (such as inputs into the machines, raw materials, operating conditions).
Dale – Tune in tomorrow. I’ve built a little tool to carry out the analysis more easily.
DaleW says
Jon – It’s a nice utility. And it would be really cool if it could be generalized to do X v. Y orthogonal regression in the absence of that special replicated pair structure you require for Deming regression now.
From additional reading, the key to this problem seems to be having a decent estimate of the ratio of random error in Y to random error in X. While not elegant, one option is to simply ask the user for his best estimate of the variance ratio of these errors, with a default of 1 (which can sometimes be appropriate when X and Y are the same units — that’s what the other Excel VBA code I mentioned assumes but doesn’t document).
A variance ratio of 0 is the same as reverse OLS regression; a variance ratio approaching infinity is the same as Ordinary Least Squares regression. Those are easy with Excel. Orthogonal regression is for the intermediate cases where both X and Y have residual error. It would be good to add X-Y orthogonal regression to your growing list of solutions that are readily available without leaving Excel . . . ?
Jan Karel Pieterse says
If I understand this problem correctly, what we’re trying to determine here is the effect of using two machines on product characteristics.
Unlike continuous process variables which you can control by e.g. turning a dial or entering a setpoint, the effect of machine is a qualitative variable.
The statistics needed to determine the effect of a machine differ from those to determine the effect of a “normal” process variable.
By using a Design of Experiments (DoE) software package, you can set up an experiment scheme which lets you determine the machine effects and (more importantly) the interactions between various process settings and the machine effects.
So if your goal is to determine machine effects, consider buying DoE (Design of Experiments) software and (even more important) taking a DoE course. Let me take this further:
I’d strongly advice ANY (yes, ANY) researcher, process engineer, …, anyone doing tests, to take a DoE course.
Jon Peltier says
JK –
The DOE suggestion is a good one for two machines used in production. In another scenario, consider that the two machines are used for measurement of some property. This regression is useful for comparing the measurements of the two machines.
Jan Karel Pieterse says
Jon: Yes, that is an important distinction. Good post by the way.
Bill Harris says
Jon, very helpful for slope intercept and correlation, but I need the 95% CIs for the slope and intercept to know if the slope is sig diff from 1.0 and if the intercept is sig diff from 0. Is that information buried somewhere in here? Thx
Jon Peltier says
Hi Bill –
The confidence interval information isn’t buried in the calculations. I didn’t implement the algorithms for these quantities.
Oliver says
When I tried the Deming regression utility it gave the exact same slope as the OLS with an r2 of 0.97.
This utility does not work.
Check out the deming regressions in 30 day trial software and you will see.
Jon Peltier says
Hi Oliver –
Can you share the data set that led to this result?
What 30-day trial software are you referring to?
Jon Peltier says
Oliver –
Your follow-up comment is posted under a different article, Deming Regression Utility.
I will look into this when I have a chance. Unfortunately it’s not as high priority as other things. But I will get to it, because I don’t like inaccuracies here.
DaleW says
Hi Oliver,
Yes, Analyse-It is a very good statistics add-in for Excel, although I haven’t needed the Method Evaluation edition with simple & weighted Deming regression.
With respect to simple Deming Regression, Jon’s numbers looked right when I checked over a year ago. When r² is very high, OLS, rOLS, diagonal regression, and Deming regression all give very similar regression lines.
Deming Regression is a special case of total least squares, which tends to be beyond what most people (possibly even Jon) care to attempt in Excel. Advanced regression techniques eventually deserve specialized tools beyond spreadsheets, and if one doesn’t want to buy commercial statistics software, then R may be a good Open Source choice. Its PCA or MethComp packages reportedly support Deming among other regression techniques.
Dale
DaleW says
Jon,
Your free utility indeed found the same simple Deming regression fit for your example with replicates as the commercial add-in Analyse-it® finds. Analyse-it® also calculates and plots the confidence intervals.
For your example, the ordinary Least Squares assumption that either Machine A or Machine B has no measurement error has negligible impact on the maximum likelihood estimator for the line, but gives an artificially tight confidence interval on the slope that is only ~57% of the more realistic interval calculated by Deming regression.
Bilal says
Hi,
I am using this Deming Regression Utility and its gives more accurate result than LR. As LR gives us value in R-sq so can we show Deming Regression result as R-sq. or just R? If we can only show as R (not R-sq.) then is this R similar to Pearson Correlation R? as I found that both have almost the same value.
Thank you.
Regards,
Muhammad Bilal
Jon Peltier says
Bilal –
The output is R, not R². It is the same as the Pearson Correlation Coefficient.
Bilal says
Hi Jon,
Thanks for your reply.
Do you know any method to calculate the R² from R? I want to show my result in R².
Thank you.
Muhammad Bilal
Jon Peltier says
R² = R * R
Leigh Ward says
Just came across your utility – excellent. Twenty years ago I wrote a template spreadsheet for LOTUS 123 to exactly this – see Ward, L.C. and Cornish, B. (1991) Use of a spreadsheet program for Deming’s linear regression analysis. Comp. Biol. Med. 37, 101. I used for various scientific data anlyses.
Muhammad Bilal says
Dear Jon,
I have few data points and applied both Linear and Deming Regressions. Slope and intercepts are same from both regressions but Deming regression provides me higher correlation (~0.07) than linear regression. Is it okay? As I understand Deming Regression estimates unbiased slope but correlation coefficient approximately same as Linear regression or Pearson Correlation. I also tried to calculate the R from slope and intercept and found that slopes and intercepts from linear and Deming regressions have same R. But I am getting higher correlation using Deming Regression utilities.
Thanks!
Regards,
Muhammad Bilal
Jon Peltier says
I don’t know if it’s okay, you know your data. Are the differences in correlation related to rounding error? If you’re copying LR coefficients from the trendline equation, you may be getting truncated values.
Ira Domsky says
I’m using the utility to assess two different air quality monitoring techniques. I was able to get the utility to work well last week, but today when I try to run it, I get what looks like an error for both X and Y input fields. Both fields are pink and no results are created. I’m using Excel 2010. I can’t figure out what I’m doing wrong.
Jon Peltier says
Ira –
Does it work on the same data that worked before, or it fails on any data?
Ira Domsky says
I added and subtracted pairs of point. It works with 32 pairs but not with 31 or 30 pairs. It worked with 40 and 42 pairs, but not with 41 pairs of points. Peculiar.
Ira Domsky says
I read the instructions more closely and realized that the function/utility requires and even number of points. I think my problem is solved. Thank you.
Jon Peltier says
That was my next suggestion. Let me know if it doesn’t work.
cheng tathong says
Weighted of unweighted deming regression should I use if the variable X and Y are measured with either constant error nor porportional error? It only measured with random error.
Jon Peltier says
Cheng –
The article does not cover weighted regression. As far as I can tell, the Deming regression algorithm I used assumes normally distributed errors in measurement of X and Y values.