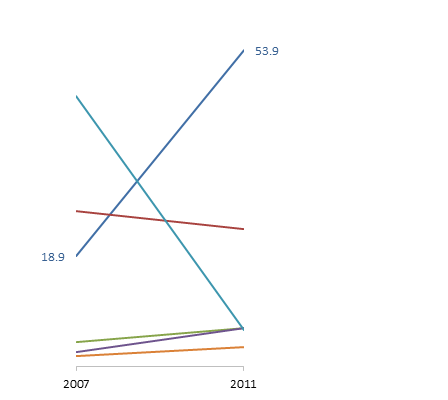
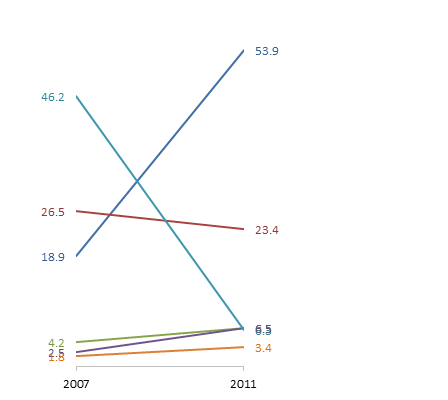
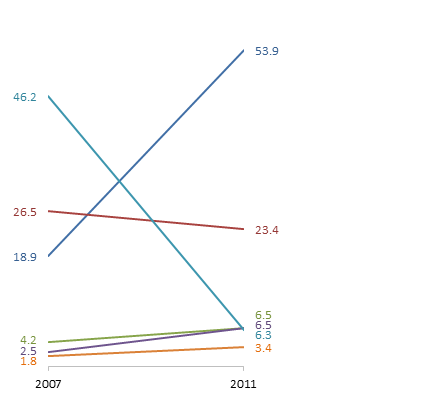
Overlapping Data Labels
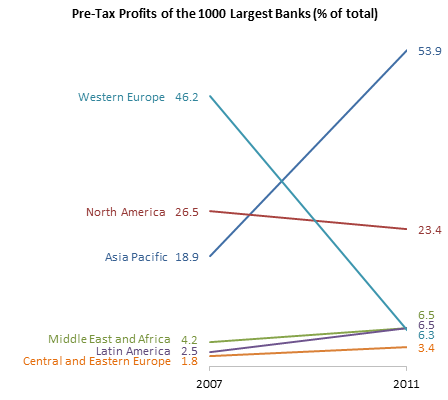
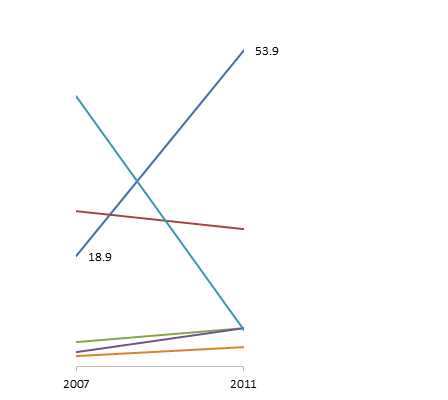
Data labels are terribly tedious to apply to slope charts, since these labels have to be positioned to the left of the first point and to the right of the last point of each series. This means the labels have to be tediously selected one by one, even to apply “standard” alignments.
I recently wrote a post called Slope Chart with Data Labels which provided a simple VBA procedure to add data labels to a slope chart; the procedure simplified the problem caused by positioning each data label individually for each point in the chart.
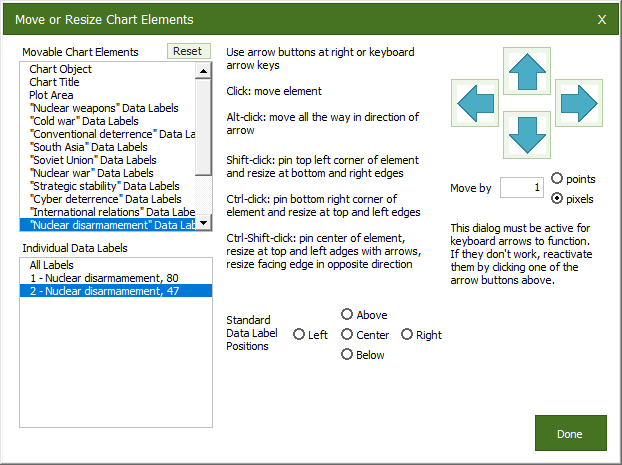
The problem is that often points are located close to each other; the result: overlapping data labels. I showed a feature in my commercial software that lets you fine-tune the position of individual data labels. But even with that helpful tool, it is still a tedious process.
A more inclusive VBA procedure that would take care of overlapping data labels is a much more difficult task. I thought about it for a while. Since each set of labels is aligned horizontally with the points they describe, I would only have to worry about vertical positioning. I would have to sort the labels by vertical position, then see if a label overlapped any subsequent label. Also, I should allow some overlap, since labels include a small white margin around their text. But it seemed like a lot of work.
My friend and colleague Andy Pope came to the rescue. He sent an email with a nifty VBA routine he’d worked out. I remembered that long ago Andy had a prototype label untangler, and I know I played with it. But what he sent me now was much better than a prototype. I tested it and liked it, then I thought about how I would build my own.
Andy’s routine used a class module to create a DataLabel object for each label that had to be realigned. His routine inserts each DataLabel object into a VBA Collection in such a way that the Collection is sorted by vertical position. Then the code loops through the labels: if two were to overlap, the upper label is moved up a tiny bit and the lower one down a little bit. This must be done iteratively because moving two labels apart might move either one closer to a third label. After looping until all labels were separated by a certain amount, the code finishes.
I decided to build a slightly different routine, because I already have a slope chart feature in my commercial software (which will be released in a new build soon), and I’d like something that worked with it. To compile all the labels, the program builds a two-column VBA array, with series numbers in the first column and vertical position in the second. The code bubble-sorts this array by the second column. Then it loops through the series numbers in a nested loop, to compare each label with every other label.
The VBA Routines
My entire module is shown below. I declare a couple of constants used in the positioning. When I move labels I do so by a pixel at a time, which in Windows is specified by MoveIncrement = 0.75 (0.75 points, to be exact). If I want to run this on a Mac, I must change MoveIncrement to 1, because this is how the Mac measures screen distances (one of the myriad incompatibilities we have to deal with). After a few trials, I set an OverlapTolerance of 0.45, meaning I would let labels overlap by 45% of their height.
The routine that does the work is FixTheseLabels. It first loops through the series of the chart, and if the series has a valid label on the point being tested (we text point 1 for the left side labels and point 2 for the right), then the series number and the top position of the label are stored in the array. If the series has no valid data label, then zeros are stored in the array.
When the array is populated, the code calls BubbleSortArrayByColumn (a routine I cobbled together years ago) to sort by the top position of the labels. After sorting the labels, the label top position in the second column of the array is no longer needed.
The code loops through the array, getting the series number from the first column; if it reads a zero, it means there isn’t a valid label, so it skips to the next array row. The program gets one label from the first loop and one from the second. If the top of the second label is less than OverlapTolerance (0.45 or 45%) higher than the bottom position of the first, the first label moves up and the second moves down.
Two lines have been inserted before the ExitSub label in the ApplySlopeChartDataLabels that call the new FixTheseLabels procedure to eliminate overlapping.
The entire code module is shown below. Here is a list of the procedures and what they do.
ApplySlopeChartDataLabelsToActiveChart
Apply Data Labels to Active Chart, and Correct Overlaps
Can be called using Alt+F8ApplySlopeChartDataLabelsInActiveSheet
Apply Data Labels to Charts on Active Sheet, and Correct Overlaps
Can be called using Alt+F8ApplySlopeChartDataLabelsInActiveWorkbook
Apply Data Labels to Charts on Active Sheet, and Correct Overlaps
Can be called using Alt+F8ApplySlopeChartDataLabelsToChart(cht As Chart)Apply Data Labels to Chartcht
Called by other code, e.g.,ApplySlopeChartDataLabelsToActiveChartFixTheseLabels(cht As Chart, iPoint As Long, LabelPosition As XlDataLabelPosition)
Correct Overlaps in Data Labels of Chartcht
Called by ProcedureApplySlopeChartDataLabelsToChartBubbleSortArrayByColumn(MyArray As Variant, iSortCol As Long)
Sorts List of Data Labels by Vertical Position
Called by ProcedureFixTheseLabels
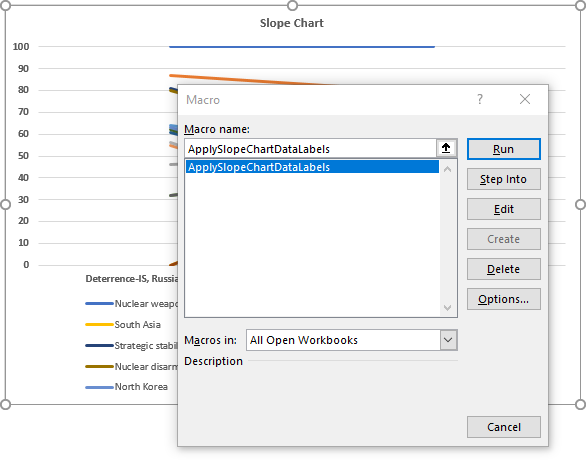
The first three procedures are helper procedures which the user can run to process the active chart, all charts on the active sheet, or all charts on all worksheets in the active workbook. They can easily be accessed with the shortcut Alt+F8 or by clicking the Macros button on the Developer tab, to open the Macro dialog.

Start of Entire Code Module
Option Explicit

Const MoveIncrement As Double = 0.75 ' 0.75 points = 1 pixel
Const OverlapTolerance As Double = 0.45
Const Overflow As String = "-nan(ind)"

Sub ApplySlopeChartDataLabelsToActiveChart()
  ApplySlopeChartDataLabelsToChart ActiveChart
End Sub

Sub ApplySlopeChartDataLabelsInActiveSheet()
  ApplySlopeChartDataLabelsInSheet ActiveSheet
End Sub

Sub ApplySlopeChartDataLabelsInActiveWorkbook()
  Dim ws As Worksheet
  For Each ws In ActiveWorkbook.Worksheets
    ApplySlopeChartDataLabelsInSheet ws
  Next
End Sub

Sub ApplySlopeChartDataLabelsInSheet(ws As Worksheet)
  Dim chob As ChartObject
  For Each chob In ws.ChartObjects
    ApplySlopeChartDataLabelsToChart chob.Chart
  Next
End Sub

Sub ApplySlopeChartDataLabelsToChart(cht As Chart)
  With cht
    .HasLegend = False
    Dim iSeries As Long
    For iSeries = 1 To .SeriesCollection.Count
      With .SeriesCollection(iSeries)
        Dim iColor As Long
        iColor = .Format.Line.ForeColor.RGB
        .HasDataLabels = True
        .HasLeaderLines = True
        With .DataLabels
          .ShowValue = True
          .ShowSeriesName = True
          .Font.Color = iColor
          .Format.TextFrame2.WordWrap = False
          With .Item(1)
            .Position = xlLabelPositionLeft
          End With
          With .Item(2)
            .Position = xlLabelPositionRight
          End With
        End With
      End With
    Next
  End With
  FixTheseLabels cht, 1, xlLabelPositionLeft
  FixTheseLabels cht, 2, xlLabelPositionRight
ExitSub:
End Sub

Sub FixTheseLabels(cht As Chart, iPoint As Long, LabelPosition As XlDataLabelPosition)
  Dim nLabels As Long
  nLabels = cht.SeriesCollection.Count
  Dim vDataLabels As Variant
  ReDim vDataLabels(1 To nLabels, 1 To 2)
  Dim iLabel As Long
  For iLabel = 1 To nLabels
    Dim srs As Series
    Set srs = cht.SeriesCollection(iLabel)
    If srs.Points(iPoint).HasDataLabel Then
      Dim dlbl As DataLabel
      Set dlbl = srs.Points(iPoint).DataLabel
      If dlbl.Position <> LabelPosition Then
        dlbl.Position = LabelPosition
        DoEvents
        DoEvents
      End If
      If CStr(dlbl.Height) <> Overflow Then
        vDataLabels(iLabel, 1) = iLabel
        vDataLabels(iLabel, 2) = dlbl.Top
      Else
        vDataLabels(iLabel, 1) = 0
        vDataLabels(iLabel, 2) = 0
      End If
    Else
      vDataLabels(iLabel, 1) = 0
      vDataLabels(iLabel, 2) = 0
    End If
  Next
  BubbleSortArrayByColumn vDataLabels, 2

  Do
    Dim DidNotOverlap As Boolean
    DidNotOverlap = True
    Dim FirstIndex As Long, SecondIndex As Long
    For FirstIndex = 1 To nLabels - 1
      If vDataLabels(FirstIndex, 1) > 0 Then
        Dim FirstLabel As DataLabel
        Set FirstLabel = cht.SeriesCollection(vDataLabels(FirstIndex, 1)). _
          DataLabels(iPoint)
        For SecondIndex = FirstIndex + 1 To nLabels
          If vDataLabels(SecondIndex, 1) > 0 Then
            Dim SecondLabel As DataLabel
            Set SecondLabel = cht.SeriesCollection(vDataLabels(SecondIndex, 1)). _
              DataLabels(iPoint)
            If FirstLabel.Top + FirstLabel.Height * (1 - OverlapTolerance) > _
              SecondLabel.Top Then
              DidNotOverlap = False
              FirstLabel.Top = FirstLabel.Top - MoveIncrement
              SecondLabel.Top = SecondLabel.Top + MoveIncrement
            End If
          End If
        Next
      End If
    Next
    If DidNotOverlap Then Exit Do
    Dim LoopCounter As Long
    LoopCounter = LoopCounter + 1
    If LoopCounter > 30 * nLabels Then Exit Do
  Loop
End Sub

Sub BubbleSortArrayByColumn(MyArray As Variant, iSortCol As Long)
  Dim FirstItem As Long, LastItem As Long
  FirstItem = LBound(MyArray, 1)
  LastItem = UBound(MyArray, 1)
  Dim LastSwap As Long
  LastSwap = LastItem
  Do
    Dim LoopCounter As Long
    LoopCounter = 1 + LoopCounter
    If LoopCounter > 10000 Then Exit Do
    Dim IndexLimit As Long
    IndexLimit = LastSwap - 1
    LastSwap = 0
    Dim iRow As Long
    For iRow = FirstItem To IndexLimit
      If (MyArray(iRow, iSortCol) > MyArray(iRow + 1, iSortCol)) Then
        ' if the items are not in order, swap them
        Dim jCol As Long
        For jCol = LBound(MyArray, 2) To UBound(MyArray, 2)
          Dim TempValue As Variant
          TempValue = MyArray(iRow, jCol)
          MyArray(iRow, jCol) = MyArray(iRow + 1, jCol)
          MyArray(iRow + 1, jCol) = TempValue
        Next
        LastSwap = iRow
      End If
    Next
  Loop While LastSwap
End Sub
End of Entire Code Module
The Result
Here is the chart with overlapping data labels, before running FixTheseLabels. Half of the labels are illegible.
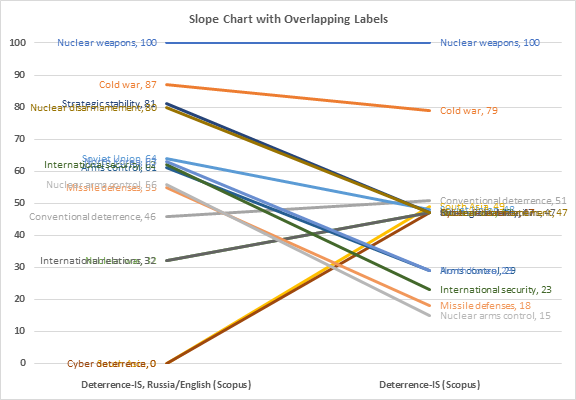
Here is the chart after running the routine, without allowing any overlap between labels (OverlapTolerance = zero). All labels can be read, but the space between them is greater than needed (you could almost stick another label between any two adjacent labels here), and some labels have moved far from the points they label.

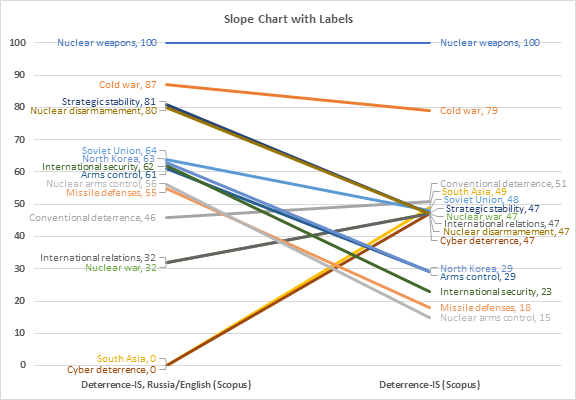
Finally, here is the chart after running the routine with OverlapTolerance = 0.45. Labels are closer together, but not too close, and some labels did not have to be moved (for example, see the lowest three labels on the right side of the chart). I tried a series of values for the overlap tolerance: zero tolerance obviously led to excessive spacing, 50% led to labels being a little too close, 40% was a little too far apart and some labels were moved that shouldn’t have to be. 45% seems to be the Goldilocks setting, though this probably varies with the font used for the labels.
