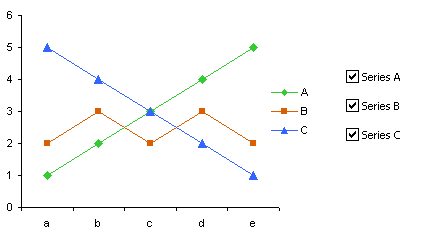
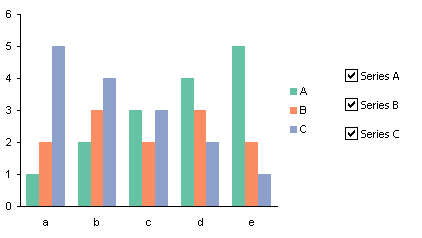
By definition an interactive dashboard contains methods for users to control which information is displayed. This can be accomplished in many ways. In Interactive Charting by Combo Box or Checkbox I wrote about using checkboxes and worksheet formulas to do this, and I elaborated on the technique in Interactive Charts with Checkboxes and Formulas.
There are a couple of shortcomings with the checkboxes-plus-formulas approach. If a series is not displayed, there is still a space for its bars in a column chart. Also, the legend key (marker in the legend) for the series is still present even if the label is hidden.
By using VBA and checkboxes together, these shortcomings can be avoided. This technique makes use of Excel’s default behavior, which does not show data in a chart if the data range is hidden. This behavior can be changed on a chart by chart basis, so that changing it for one chart does not change it for other charts.
Checkboxes and VBA
Start with a line or column chart that includes all of the series you will allow the user to select from (A, B, and C in this example). Add a checkbox from the Forms toolbar for each series.


[Read more…] about Interactive Charts with Checkboxes and VBA


