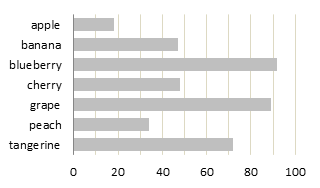
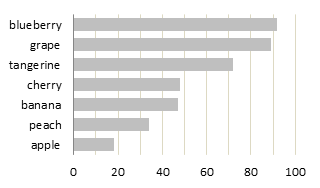
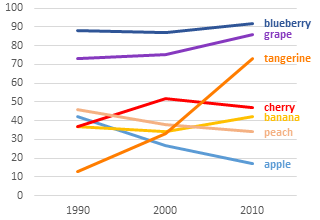
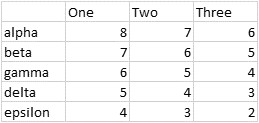
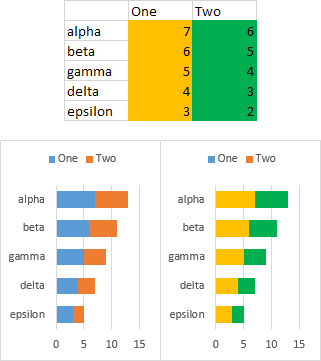
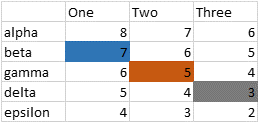
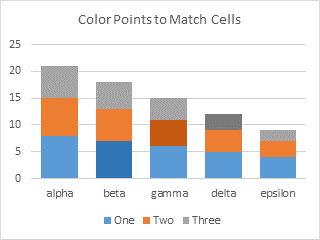
A user of my Peltier Tech Charts for Excel 3.0 asked recently whether this program could perform interactive formatting of all series 2 in a set of charts to the same color.
Well, my program does many things, but it can’t do this. Such a highly specific feature is hard to support in a general purpose program. Next, someone will want to change all series 1 or series 3 or series named “Values”, or they’ll want a different color. It’s difficult to program for all of the various possibilities. (We can try, as I’ll show later.)
But if you need something particular like this, it’s not hard to spin your own VBA code.
Simple Code for Interactive Formatting
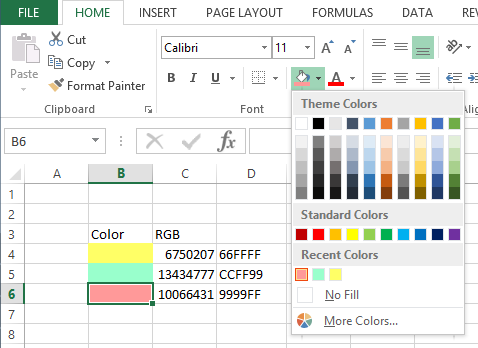
For my user’s request, it was as simple as filling a cell (say, H5) with a certain color, then changing the lines for each “Series2” in his charts to this color. The code looks like this:
Sub ColorSeries2LikeCellH5()
  Dim iColor As Long
  Dim shp As Shape
  Dim chob As ChartObject

  ' get the color
  iColor = ActiveSheet.Range("H5").Interior.Color

  If Not ActiveChart Is Nothing Then
    ' active chart (one chart selected)
    ActiveChart.SeriesCollection(2).Format.Line.ForeColor.RGB = iColor
  ElseIf TypeName(Selection) = "DrawingObjects" Then
    ' multiple charts selected
    For Each shp In Selection.ShapeRange
      If shp.HasChart Then
        shp.Chart.SeriesCollection(2).Format.Line.ForeColor.RGB = iColor
      End If
    Next
  Else
    ' no chart selected so do all charts
    For Each chob In ActiveSheet.ChartObjects
      chob.Chart.SeriesCollection(2).Format.Line.ForeColor.RGB = iColor
    Next
  End If
End Sub
Which Chart to Format?
Let’s look a little closer at one piece of this code, which determines whether to work on one chart (the active chart), multiple selected charts (selected using Ctrl+Click or Shift+Click), or all charts on the active sheet (if no chart was selected). I’ve color-coded the explanations and the code sections.
If one chart is selected, then there is an active chart. The strange line of code “If Not ActiveChart Is Nothing Then” really means “If ActiveChart Is Something Then“, so we should process the active chart.
If multiple charts are selected, the selection consists of a collection called “DrawingObjects“, so we should process each shape in this collection (which is also a “ShapeRange“), provided that shape contains a chart.
Finally, if neither of these conditions are met (that is, no chart is selected), we’ll process each chart object on the active sheet. If there are no chart objects, the code will just finish up.
  If Not ActiveChart Is Nothing Then
    ' active chart (one chart selected)
    ' --> Process active chart
  ElseIf TypeName(Selection) = "DrawingObjects" Then
    ' multiple charts selected
    For Each shp In Selection.ShapeRange
      If shp.HasChart Then
        ' --> Process each selected shape that contains a chart
      End If
    Next
  Else
    ' no chart selected so do all charts
    For Each chob In ActiveSheet.ChartObjects
      ' --> Process each chart object on the active sheet
    Next
  End If
How do I know all of this stuff? Well, I’ve been around for a long time, and I’ve swiped code from a lot of experts.
The code above is pretty good, but it’s not very flexible. If you need to get the color from a different cell, you need to edit the command that references cell H5. You need similar changes if you need to format a different series. This is fine if it’s your own code, but not if the user is your colleague who isn’t VBA-savvy.
Better, Flexible Interactive Formatting Code
So let’s add a couple mini-dialogs to ask the user what we should do. This makes it truly interactive formatting.
Which Cell Has the Desired Color?
First we’ll use Application.InputBox to ask the user which cell is filled with the color we want to use.
  On Error Resume Next
  Set rng = Application.InputBox("Select a cell filled with the desired line color", _
      "Select a Colored Cell", , , , , , 8)
  If rng Is Nothing Then GoTo ExitSub
  On Error GoTo 0
  iColor = rng.Interior.Color
This pops up the following dialog:

The 8 as the last argument for InputBox tells VBA to expect the user to supply a range.
We use “On Error Resume Next” because if the user cancels the InputBox, “Set rng =” will return an error. Bypassing the error, if the user cancels, rng will not be defined, so we will branch to ExitSub, a label at the end of the procedure.
If the user selects a cell with not fill color applied, the color white will be applied to the applicable series. This probably isn’t what you want, but at least the code doesn’t produce any ugly run-time errors.
Which Series Should We Change?
Next, we’ll use Application.InputBox to ask the user which series to change.
  vSrs = Application.InputBox("Enter the series number or name to be changed", _
      "Identify Series", , , , , , 3)
  If TypeName(vSrs) = "Boolean" Then GoTo ExitSub
This produces another dialog:
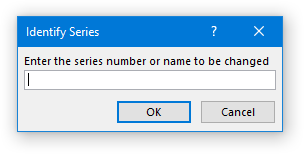
Using 1 as the last argument for InputBox tells VBA to expect a number, while using 2 tells VBA it’s text; we’ve used 3, which means number or text (3 = 1 + 2).
If the user cancels, what is returned is the Boolean value False (not the text value “False”). So we test for a Boolean, and if we get one, we branch to the ExitSub label as above.
If the number or name entered by the user does not correspond to an existing series in the chart, an ugly run-time error occurs. It’s a little more complicated to bypass the error, but your users deserve the best.
The error is handled by modifying a line of code like this:
ActiveChart.SeriesCollection([series number or name]).Format.Line.ForeColor.RGB = iColor
First, at the top of the procedure, declare a new object variable to represent the series being sought
Dim oSrs As Series
Then you need to prevent Excel from halting at the error when it finds no matching series, and turn error behavior back on, assign the object variable to the desired series, and if this assignment works (remember, “If Not oSrs Is Nothing” means “If oSrs is Something“), format the series:
  On Error Resume Next
  Set oSrs = ActiveChart.SeriesCollection(vSrs)
  On Error GoTo 0
  If Not oSrs Is Nothing Then
    oSrs.Format.Line.ForeColor.RGB = iColor
  End If
The Improved Routine
So here’s the new and improved routine:
Sub ColorSeriesLikeCell()
  Dim rng As Range
  Dim vSrs As Variant
  Dim iColor As Long
  Dim shp As Shape
  Dim chob As ChartObject
  Dim oSrs As Series
  ' get cell filled with desired color
  On Error Resume Next
  Set rng = Application.InputBox("Select a cell filled with the desired line color", _
      "Select a Colored Cell", , , , , , 8)
  If rng Is Nothing Then GoTo ExitSub
  On Error GoTo 0
  iColor = rng.Interior.Color

  ' identify the series
  vSrs = Application.InputBox("Enter the series number or name to be changed", _
      "Identify Series", , , , , , 3)
  If TypeName(vSrs) = "Boolean" Then GoTo ExitSub

  If Not ActiveChart Is Nothing Then
    ' active chart (one chart selected)
    On Error Resume Next
    Set oSrs = ActiveChart.SeriesCollection(vSrs)
    On Error GoTo 0
    If Not oSrs Is Nothing Then
      oSrs.Format.Line.ForeColor.RGB = iColor
    End If
  ElseIf TypeName(Selection) = "DrawingObjects" Then
    ' multiple charts selected
    For Each shp In Selection.ShapeRange
      If shp.HasChart Then
        Set oSrs = Nothing
        On Error Resume Next
        Set oSrs = shp.Chart.SeriesCollection(vSrs)
        On Error GoTo 0
        If Not oSrs Is Nothing Then
          oSrs.Format.Line.ForeColor.RGB = iColor
        End If
      End If
    Next
  Else
    ' no chart selected so do all charts
    For Each chob In ActiveSheet.ChartObjects
      Set oSrs = Nothing
      On Error Resume Next
      Set oSrs = chob.Chart.SeriesCollection(vSrs)
      On Error GoTo 0
      If Not oSrs Is Nothing Then
        oSrs.Format.Line.ForeColor.RGB = iColor
      End If
    Next
  End If

ExitSub:
End Sub
Well, that’s pretty nifty. But what if I have something besides a line chart?
Best, Versatile Interactive Formatting Code
Now we’ll add the capability to check each series chart type, and use the appropriate formatting syntax to change the line color, the marker color, or the fill color. To keep from repeating a lot of this code for checking series chart type, I’ll introduce a function to call to change the series formatting. Using a function also means that if I need to change or enhance the feature, I only need to change it one time in the function, and not everywhere I use the feature.
What’s the Chart Type?
I’ll pass the series and the color into the function, and it will determine based on the series chart type. The function will have this form:
Function RecolorSeries(srs As Series, iClr As Long) As Boolean
  ' assume True unless otherwise
  RecolorSeries = True

  Select Case srs.ChartType
    Case [Line] and [Scatter with Line Only]
      ' --> change line color

    Case [Line with Markers] and [Scatter with Lines and Markers]
      ' --> change line color
      ' --> change marker color (foreground and maybe background)

    Case [Scatter with Markers Only]
      ' --> change marker color (foreground and maybe background)

    Case [Bar], [Column], and [Area]
      ' --> change fill color

    Case Else
      ' did not reformat a series
      RecolorSeries = False
  End Select
End Function
We can call it like this (which is how I’ll call it)
RecolorSeries [series], [color]and it will run like a sub, or like
bDidItWork = RecolorSeries([series], [color])and it will still run like a sub, but then return the value True to bDidItWork if it formatted a series and False if it did not. You could then notify the user if one or more series were not changed because of their chart type.
Should We Fill the Marker?
We want to change the MarkerForegroundColor of any markers, but the MarkerBackgroundColor only if it is reasonable to fill the marker. For the Plus, X, and Star markers, filling the marker results in a big ugly square marker where the Plus, X, or Star foreground is not distinguished from the background. We could probably get more creative based on whether the existing background color matches the foreground, but this is just a blog post, eh?
So anyway, after we do the MarkerForegroundColor, we test for the marker style:
      Select Case srs.MarkerStyle
        Case xlMarkerStylePlus, xlMarkerStyleStar, xlMarkerStyleX
          ' fill should not be changed
        Case Else
          ' --> change the fill
      End Select
The Reformatting Function
All fixed up the function looks like this:
Function RecolorSeries(srs As Series, iClr As Long) As Boolean
  ' assume True unless otherwise
  RecolorSeries = True

  Select Case srs.ChartType
    Case xlLine, xlLineStacked, xlLineStacked100, _
        xlXYScatterLinesNoMarkers, xlXYScatterSmoothNoMarkers
      ' change line color
      srs.Format.Line.ForeColor.RGB = iClr

    Case xlLineMarkers, xlLineMarkersStacked, xlLineMarkersStacked100, _
        xlXYScatterLines, xlXYScatterSmooth
      ' change line color and marker color
      srs.Format.Line.ForeColor.RGB = iClr
      srs.MarkerForegroundColor = iClr
      Select Case srs.MarkerStyle
        Case xlMarkerStylePlus, xlMarkerStyleStar, xlMarkerStyleX
          ' fill should not be changed
        Case Else
          srs.MarkerBackgroundColor = iClr
      End Select

    Case xlXYScatter
      ' change marker color
      srs.MarkerForegroundColor = iClr
      Select Case srs.MarkerStyle
        Case xlMarkerStylePlus, xlMarkerStyleStar, xlMarkerStyleX
          ' fill should not be changed
        Case Else
          srs.MarkerBackgroundColor = iClr
      End Select

    Case xlBarClustered, xlBarStacked, xlBarStacked100, _
        xlColumnClustered, xlColumnStacked, xlColumnStacked100, _
        xlArea, xlAreaStacked, xlAreaStacked100
      ' change fill color
      srs.Format.Fill.ForeColor.RGB = iClr

    Case Else
      ' did not reformat a series
      RecolorSeries = False
  End Select
End Function
The Finished Main Routine
The main routine now looks like this, and it works in conjunction with the function above:
Sub RecolorSeriesLikeCell()
  Dim rng As Range
  Dim vSrs As Variant
  Dim iColor As Long
  Dim shp As Shape
  Dim chob As ChartObject
  Dim oSrs As Series

  ' get cell filled with desired color
  On Error Resume Next
  Set rng = Application.InputBox("Select a cell filled with the desired color", _
      "Select a Colored Cell", , , , , , 8)
  If rng Is Nothing Then GoTo ExitSub
  On Error GoTo 0
  iColor = rng.Interior.Color

  ' identify the series
  vSrs = Application.InputBox("Enter the series number or name to be changed", _
      "Identify Series", , , , , , 3)
  If TypeName(vSrs) = "Boolean" Then GoTo ExitSub

  If Not ActiveChart Is Nothing Then
    ' active chart (one chart selected)
    On Error Resume Next
    Set oSrs = ActiveChart.SeriesCollection(vSrs)
    On Error GoTo 0
    If Not oSrs Is Nothing Then
      RecolorSeries oSrs, iColor
    End If
  ElseIf TypeName(Selection) = "DrawingObjects" Then
    ' multiple charts selected
    For Each shp In Selection.ShapeRange
      If shp.HasChart Then
        Set oSrs = Nothing
        On Error Resume Next
        Set oSrs = shp.Chart.SeriesCollection(vSrs)
        On Error GoTo 0
        If Not oSrs Is Nothing Then
          RecolorSeries oSrs, iColor
        End If
      End If
    Next
  Else
    ' no chart selected so do all charts
    For Each chob In ActiveSheet.ChartObjects
      Set oSrs = Nothing
      On Error Resume Next
      Set oSrs = chob.Chart.SeriesCollection(vSrs)
      On Error GoTo 0
      If Not oSrs Is Nothing Then
        RecolorSeries oSrs, iColor
      End If
    Next
  End If

ExitSub:
End Sub

