This week in the Mr Excel forum, someone wanted to know how to set Graph Colors to match cell colors. A couple years back, my good buddy Mike Alexander presented code that Color Pie Chart Slices to Match their Source Cells. But I thought of a couple enhancements and I need to increase my posting frequency, so here goes.
Basic Data and Chart
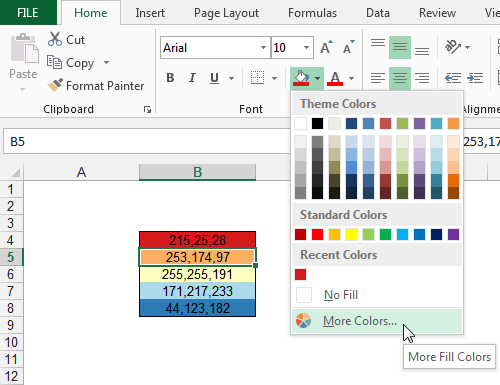
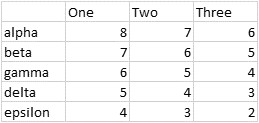
Start with a simple data set:
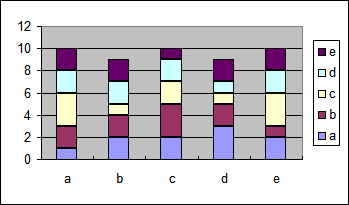
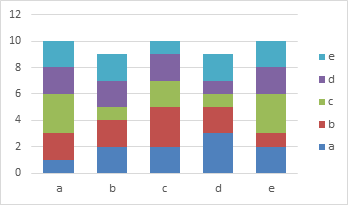
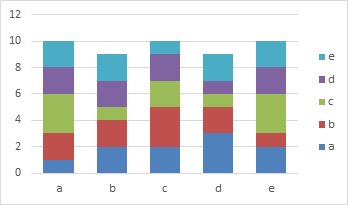
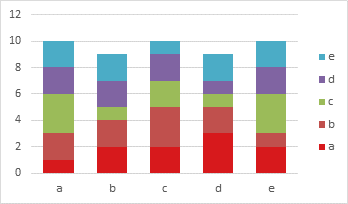
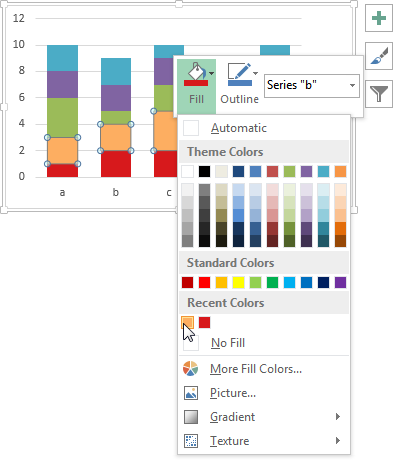
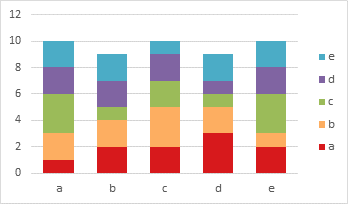
Create a stacked column chart:
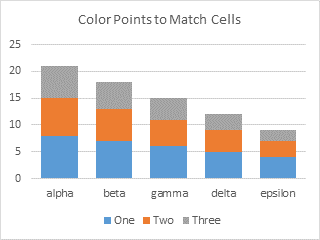
This will work with stacked or clustered column charts, stacked or clustered bar charts, and pie charts.
Formatted Data and Chart
Enhancement Number One: Work on all reasonable chart types that use fill colors for each point.
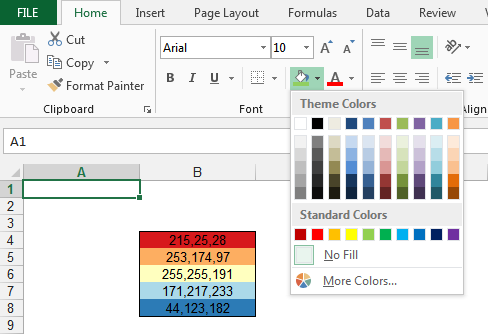
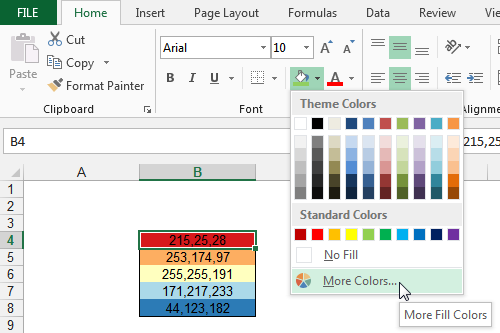
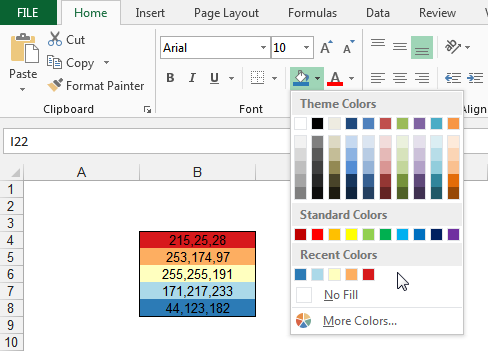
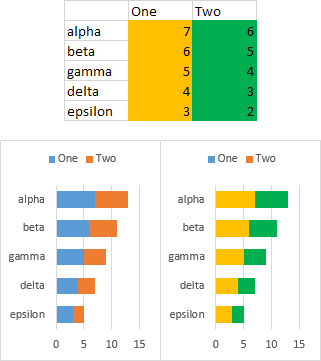
Apply the fill colors to the cells that you want applied to the plotted points. Just fill colors; the VBA code will ignore borders and skip any cells that don’t have a simple “Solid” fill pattern.
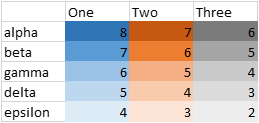
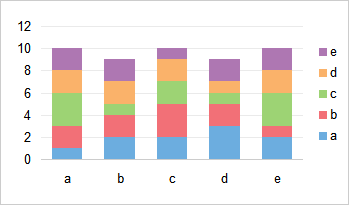
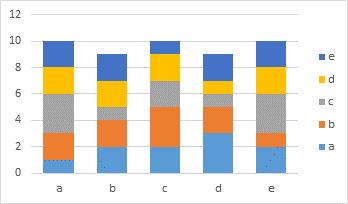
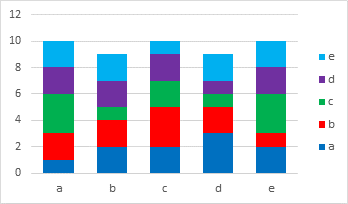
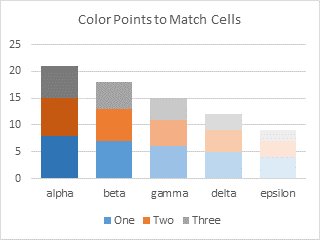
Select the chart and run the procedure. The points (bars) will be filled with the same colors as the corresponding cells.
It works on bar charts too.
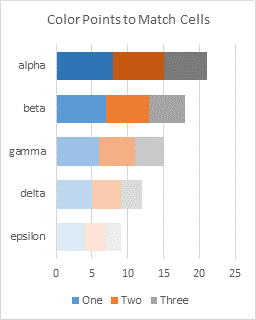
Note that the legend colors haven’t changed, because we’ve changed the points one-by-one, and haven’t changed the series. Even if you changed all points in a series to the same new color, the legend will still show the old color. See?
Partially Highlighted Data and Chart
Enhancement Number Two: Apply fill colors only to certain highlighted points.
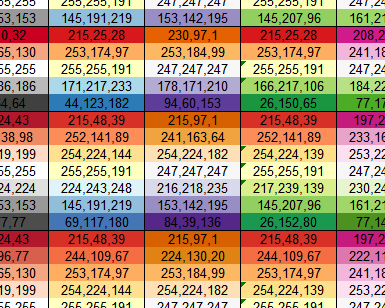
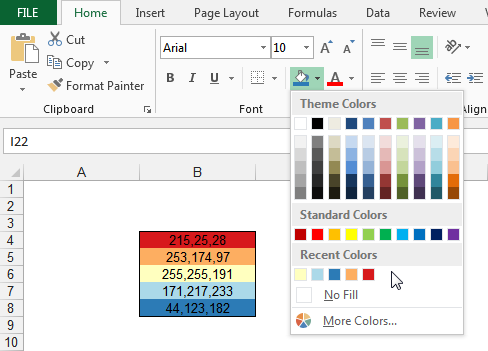
That was pretty cool. What if I only want to change the colors of some of the points, indicated by the selective colors of the following data set?
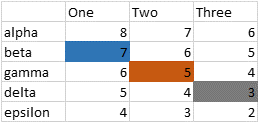
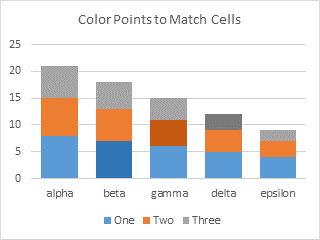
Look, it works! The program skips any cells with no fill color (in code, it skips cells with a fill pattern of “None”).
The VBA Procedures
The first procedure is a stub that is used to reformat the active chart.
Sub ColorActiveChartPointsToMatchCells()
  If Not ActiveChart Is Nothing Then
    ColorPointsToMatchCells ActiveChart
  End If
End Sub
You can call the main procedure inside of any other code to format a chart you’re working on, like this:
ColorPointsToMatchCells ChartIAmWorkingOnA variation allows you to format all selected charts at once (use Ctrl+Click to select multiple charts):
Sub ColorSelectedChartPointsToMatchCells()
  If Not ActiveChart Is Nothing Then
    ColorPointsToMatchCells ActiveChart
  ElseIf TypeName(Selection) = "DrawingObjects" Then
    Dim shp As Shape
    For Each shp In Selection.ShapeRange
      If shp.HasChart Then
        ColorPointsToMatchCells shp.Chart
      End If
    Next
  End If
End Sub
The second procedure accepts a chart as input. It cycles through all series in the chart. If the chart type of the series isn’t column, bar, or pie, it skips that series. Otherwise it parses the series formula to find the formatted range containing the series Y values. The code then loops through the points in the series (and the cells in the source data range), and if the cell has a simple “Solid” fill pattern, it uses the fill color of the cell as the fill color of the corresponding point.
Sub ColorPointsToMatchCells(cht As Chart)
  Dim srs As Series
  Dim sFmla As String
  Dim vFmla As Variant
  Dim sYvals As String
  Dim rYvals As Range
  Dim iPt As Long
  Dim nPts As Long

  If cht Is Nothing Then GoTo OuttaHere

  For Each srs In cht.SeriesCollection
    Select Case srs.ChartType
      ' only do pie, bar, column charts
      Case xlPie, xlBarClustered, xlBarStacked, xlBarStacked100, _
          xlColumnClustered, xlColumnStacked, xlColumnStacked100

        On Error GoTo SeriesError

        ' get series information
        sFmla = srs.Formula
        nPts = srs.Points.Count
        vFmla = Split(sFmla, ",")
        sYvals = vFmla(LBound(vFmla) + 2)
        Set rYvals = Range(sYvals)

        For iPt = 1 To nPts
          ' don't change point color if cell has no fill color
          If rYvals.Cells(iPt).Interior.Pattern = xlSolid Then
            srs.Points(iPt).Interior.Color = rYvals.Cells(iPt).Interior.Color
          End If
        Next
    End Select

SeriesError:
    On Error Resume Next
  Next

OuttaHere:

End Sub
Note that I used
srs.Points(iPt).Interior.Color = rYvals.Cells(iPt).Interior.Colorto format the points of the series. The Interior property of a chart series has been deprecated, and the official syntax has changed to the much simpler and easier to remember </snark>
srs.Points(iPt).Format.Fill.ForeColor.RGB = rYvals.Cells(iPt).Interior.ColorBut it seemed to make sense to use Interior for both cell and point, especially in this case deprecated doesn’t mean “no longer works”.


