I talked about LOESS smoothing in LOESS Smoothing in Excel, where I showed my improved VBA function for calculating smoothed data. I introduced an improved LOESS Smoothing utility in LOESS Utility for Excel. Since I use the utility frequently, I encountered many things about it that I wanted to change. Since I am the developer of the utility, I have actually been able to make these changes. And after a few months of use and a few hour-long sessions aimed at making it do what I want it to do, I’ve developed this utility into something that is, in the local vernacular, “wicked awesome”. If you’ve never seen “Good Will Hunting”, that means “way cool”.
What makes this utility so great, you ask? The calculations were already perfectly adequate, and I didn’t change them at all. But I’ll show the new dialog, so you can see what has changed.
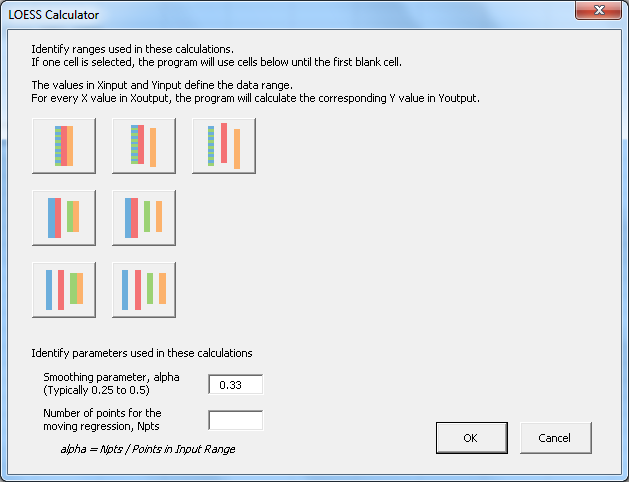
First, the previous interface for selecting input and output ranges was frustratingly restrictive. So I made the range selection function much more flexible. The colorful buttons on the left indicate the built-in options. In the most elementary case, all four entries (X input, Y input, X output, and Y output) are separate ranges, which can even be located on separate worksheets.
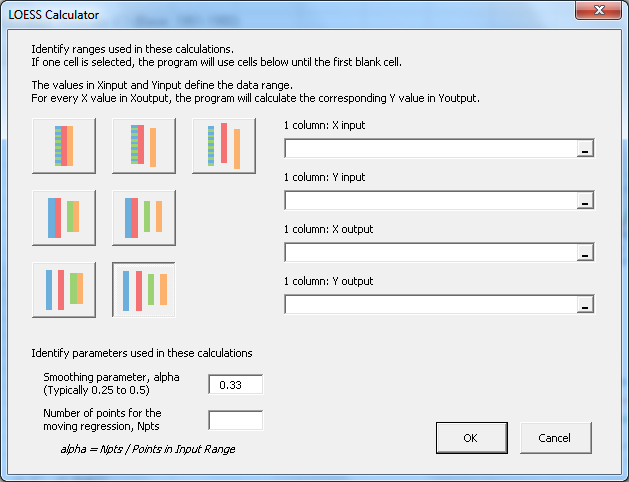
The options make range selection easier if some columns happen to be adjacent to each other, or if the same X values are to be used for both input and output. The range selection (Ref Edit) boxes and related labels update according to which option has been selected.
When the X input range has been selected, the program determines Npts, the number of points that should be used for the selected value of alpha. When the user changes alpha or Npts, the other parameter updates.
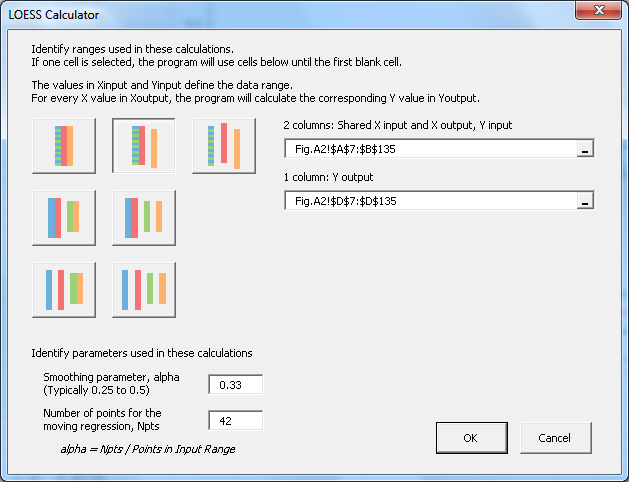
In the following case, one column serves as X input and X output (A7:A135), the adjacent column holds the Y input data (B7:B135), and the program will dump the Y output into a separate column (D7:D135).
Even this wasn’t smooth enough for me, because I got tired of scrolling up and down to select long ranges. So I made another improvement. I made the program smart enough to know that if only one row had been selected, it should use the range of data below the selected row, stopping at the first empty cell.
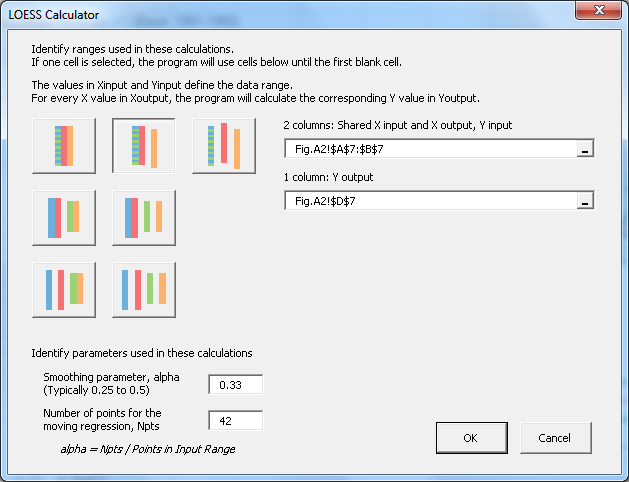
Couldn’t be easier.
The last change I made was to have the utility store the last LOESS parameters in each worksheet. This way, if I run a particular analysis on each sheet in a workbook, I only have to activate that sheet, run the program, and the dialog is pre-populated with the settings I need. What a time-saver!
PTS LOESS Utility Demo
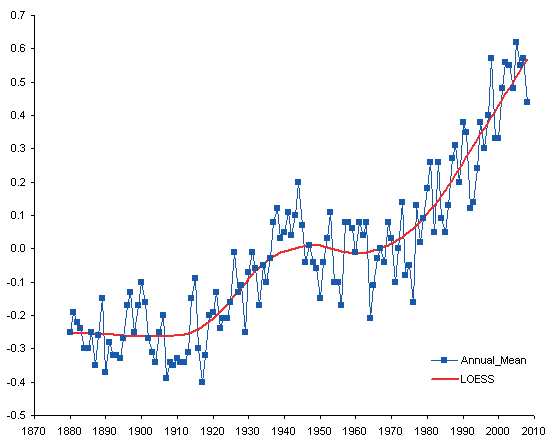
Here is a demo of the new utility. This analysis only took a few minutes. I started with some Global Temperature Anomaly data from NASA.
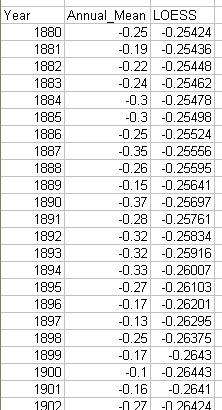
I ran the utility to generate a smoothed temperature anomaly curve.
Then ran the utility a few more times to see the effect of alpha (number of points in the moving linear regression) on the shape of the smoothed curve. The values of 42, 25, and 12 points correspond to alpha values of 0.33, 0.2, and 0.1.
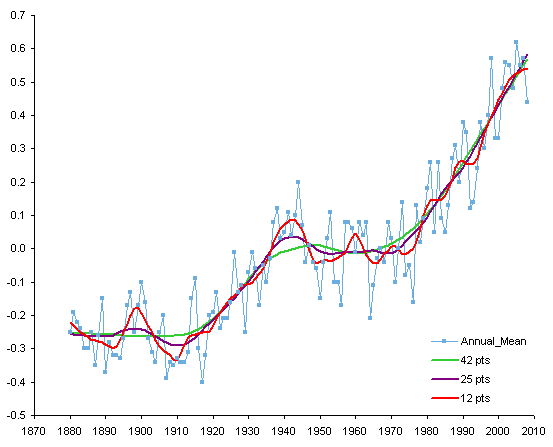
The fewer points (i.e., smaller alpha) in an analysis, the more that the smoothed curve follows local variations in the data.
What the Buttons Mean
I’ve written a companion article, LOESS Utility – What the Buttons Mean, that shows how to use the different buttons in the dialog for the various input data layouts that you may have.
Mac Users
This utility was written in 2009 for Excel 2003 for Windows. It has a button that appears on the Excel 2003 menu, and later versions of Excel for Windows place duplicate buttons on the Add-Ins tab of the ribbon. The utility was not updated for Excel 2007 and later for Windows, and no steps were taken to make it as nice in Mac Excel.
During installation, Mac Excel 2011 ignores the code that produces these buttons, while Mac Excel 2016 displays two error messages saying Run-time error 5: Invalid procedure call or argument. Despite this, the add-in can still be used in Excel for Mac.
Installation
In Mac Excel 2011, go to the Tools menu > Add-Ins, click the Select… button, navigate to the PTS_LOESS.xla file, then click OK to return to Excel.
In Mac Excel 2016, go to the Tools menu > Add-Ins or click the Excel Add-Ins button on the Developer tab of the ribbon, click the Browse… button, navigate to the PTS_LOESS.xla file, then click OK to return to Excel.
Running the Utility
Because the interface elements do not appear in either version of Mac Excel, you need to run the VBA procedure by name.
In Mac 2011, go to the Tools menu > Macro > Macros…, enter LoessDialog as the name of the macro, and click Run.
In Mac 2016, go to the Tools menu > Macro > Macros… or click the Macros button on the Developer tab of the ribbon, enter LoessDialog as the name of the macro, and click Run.
Dialog Size and Appearance
Since Windows uses points as its main unit of measure while Mac uses pixels, the dialogs are shrunken by 25% on the Mac (a pixel is only 75% as large as a point). The dialog color on the Mac is a very drab gray, and the buttons and other controls are unattractive.
When the dialog first appears in Mac Excel 2011, it looks like this. The icons are missing from the buttons (another Windows-Mac-Excel-VBA incompatibility), and the various textboxes which match the dialog background in Windows are much lighter on the Mac. You will need to refer to my article LOESS Utility – What the Buttons Mean to see which button is which.

You can tell which button has been clicked (button 3 below) and you can easily tell which data entry boxes are available.

The dialog color isn’t as drab in Mac Excel 2016, the textboxes match in color, and the button icons are all visible.

LOESS Smoothing in Peltier Tech Charts for Excel

I liked this utility and used it so much, that I’ve included an enhanced version in my commercial Excel Charting software, Peltier Tech Charts for Excel .
Dialog Appearance
Here’s the dialog in Excel for Windows (Excel 2007 to 2016 shown in Windows 10).

Here’s the dialog in Excel 2011 for Mac.

And Here’s the dialog in Excel 2016 for Mac.

The dialogs look substantially the same and work exactly the same in all of these versions.
Enhancements
I’ve made numerous improvements to this utility in the seven years since I released the free demo in this article. The ones that come to mind off the top of my head:
- Data Improvement:
- Data is internally sorted by X prior to running the analysis.
- Missing data (X or Y) is ignored during the analysis.
- Algorithms are less sensitive to factors that previously caused errors (too much input at repeated X values, too few points in the analysis).
- If X output prediction range extends beyond X input data range, you can decide not to extrapolate below minimum or above maximum X values.
- Algorithm Improvement:
- You can use a moving quadratic (2nd order) regression instead of the normal 1st order regression. This is slower than the first order computation, but not as much slower as I feared.
Please visit the Peltier Tech Charts for Excel page for more information.
References
Cleveland, W.S. (1979), “Robust Locally Weighted Regression and Smoothing Scatterplots,” Journal of the American Statistical Association, Vol. 74, pp. 829-836.
Cleveland, W.S. and Devlin, S.J. (1988), “Locally Weighted Regression: An Approach to Regression Analysis by Local Fitting,” Journal of the American Statistical Association, Vol. 83, pp. 596-610.
NIST Engineering Statistics Handbook, 4.1.4.4. LOESS (aka LOWESS)
NIST Engineering Statistics Handbook, Example of LOESS Computations
Wikipedia, Local regression


Bob says
Way to go Jon.
Can’t wait to play with this.
Cheers,
Bob
Jerry Betz says
Jon,
Ayuh, wicked gorgeous. Many thanks.
Jerry
Kurt says
Hi Jon,
tried your LOESS-Tool, it installs a Menu
“PTS Charts” in my Excel 2003. clicking this
menu I have *two* indentical menu-entries
“LOESS”
Do you have any hint, what mistake I made?
thanks
Kurt
Jon Peltier says
Kurt –
I don’t know why that happened. Before you quit Excel next time, go to View menu > Toolbars > Customize, then you can click on the PTS Charts menu and drag it off the menu bar to delete it. When you restart Excel, there should then be only one LOESS item.
Bob says
Hi Jon,
The same thing happened to me in Office 2007 SP2 and all the patches.
Works fine. I also have the error bar utility you cooked up for Excel 2007. Happy camper.
Thanks for your hard work.
Cheers,
Bob
Jon Peltier says
I’ll have to check that when I get a chance. At least the underlying utility works. At least for N > 4, that is, because one early tester found problems with very small N.
Kurt says
Jon,
the sugested procedure did not work for me.anyway it is just a “cosmetic” thing.
thanks for making this tool available for free
Kurt
Jon Peltier says
Kurt – I’ll dig into the code, see what might be messing up the interface.
Stephen Hughes says
Is there a minimum version of Excel needed to run this? I’ve got 97 but get a ‘Compile Error in Hidden Module: M_LOESS’ error when I try to run it.
Any suggestions would be appreciated as I need a program to smooth out experimental data.
Jon Peltier says
Stephen –
There was a major upgrade of VBA between Excel 97 and Excel 2000, and Macs have never gotten this upgrade. I would expect all of my code to work fine in Excel 2000 and later, but I would expect problems in Excel 97 and Mac Excel.
I don’t know if I even still have Excel 97 disks. If I do, maybe I’ll install it in a VM and see where the code falls down.
Stephen Hughes says
Hi Jon,
Anything you can manage would be appreciated! Meanwhile I’ll try (again) to persuade my boss of the benefits of having a modern computer and up-to-date software!
Jon Peltier says
The bare minimum is Excel 2000, but I’m sure that would be nearly impossible to find. The best version so far is Excel 2003, and even that isn’t easy to get your hands on.
Omair Noor says
Hi Jon,
I have approximately 2400 data points per column. I tried to use your LOESS utility function, but i get the following error:
Run-time error ‘6’:
Overflow.
Any idea how should i be going about resolving this problem.
Thanking in anticipation.
Jon Peltier says
Hi Omair –
I just did some fooling around, and had no problem with a data set with 5000 points. But I used some vanilla data, and yours may have some characteristic that makes it behave differently.
Is it possible to send me a sample? jonpeltier at-sign gmail period com.
tom says
I also experienced the runtime error.
Does it have to do with very small alpha values? I chose 20 points out of 2000.
bug #2:
The utility crashes from the menu if Excel is opened without any workbook.
bug #3:
Sometimes the dialog disappears when I am entering ranges in the text boxes.
idea:
Could you add something like a auto-fit for columns in the tool. I rather would like
to add full columns. The utility could start the range below the last text row and
would end the range before the first empty cell.
Jon Peltier says
Tom –
I don’t know what may have caused your first error. When it was reported last time, the problem was resolved by selecting just the data, not the entire column. I have added a slightly different dange auto-detect feature. Select the top cell in a range of data (the first data cell, not the header), and the utility will detect how far down the column the range extends.
I also don’t know about the second crash. Similar problems arise if not all upgrades and service packs have been installed.
How frequently does the dialog vanish? I see it once in a while, perhaps once every few dozen times I run the utility. I’ve just assumed it was related to the inherent instability of the RefEdit used to select the data ranges.
Nick says
Hi Jon!
Nice little utility you have here! I’m utterly hopeless at math and I have a report involving normalizing microarray data, which requires me to apply LOESS to some data. I have trouble following your example of plotting LOESS for anomaly data for NASA. There are seven choices for entering the data and I don’t know which to choose! If you give a step by step instruction of how you used the add in, it would be great.
Please help the mathematically crippled biologist!
Jon Peltier says
Nick – I’m preparing some documentation for a new article. Stay tuned.
K Hayhoe says
any chance of a Mac versions for this and all your other great add-ins, pleeease?
Jon Peltier says
Katharine –
The problem is that the version of Visual Basic in Mac Excel is a generation older than that in Windows Excel. There are some incompatibilities in the code because of this, and I have no means to test the older code.
david says
Hi John,
I’m also attempting to run your loess app on some microarray data. I’m not certain if it’s working properly or not. My data consists of ~385k values (I can break into subsets of 2 30k and 2 150k).
I’m using the “3 adjacent column” button. When I hit it, the task manager says Excel is not responding. I’ve experienced this before with large data sets (this one is a smaller one for me), analysis and Excel. So I walk away — after a 1/2 hour it’s still not responding — with either the 30k, 150k or the 380k.
Should I wait longer??
Thanks
Excel 2007
Windows XP, x64 SP2
Dell Precision T5500, 2.27ghz, 24g RAM
Jon Peltier says
David –
That’s a lot of points. Is LOESS the right way to smooth your data set?
To get a handle on how long the analysis should take (on my computer) I started with some dummy data, and ran a series of LOESS analyses on it. I tested 10 to 10,000 points, with alpha=0.5. Times to calculate the LOESS fit are shown in this table. Each time shown is the average of six runs, except the time for 10,000 points is the average of three runs.
The slope of the right side of the curve is close to 2, which jibes with my faint recollection that the time to compute a regression is proportional to the number of points squared, and the LOESS fit is basically a set of regressions. If I extrapolate to 30k, 150k, and 380k points, I predict times of 31 minutes, 13 hours, and 86 hours.
DD says
Can’t get this to work at all in Excel 2007.
Steps to reproduce:
1. Go to Add-Ins and select “PTS Charts => LOESS”
2. Choose the button in the lower right (four columns)
3. Select 270 values for X
4. Select 270 next to it for Y
5. Do the same for output (other columns)
6. Type “0.25” in the alpha box (Number of points updates to 67)
7. Press OK
Result is X output empty and Y output containing the same value repeated 270 times.
I can pick any data, and this is always the result.
Jon Peltier says
DD –
Does the X output range contain values? It should either contain values (e.g., if you want to specify different points than are in the X input range, or you should use an option that uses the X input range for input and output.
david says
Hi John,
Thanks for your excellent reply, and please accept my apology for my delayed response.
Yes, it’s many data points, but it’s actually a small data set for us (thus the use of Excel). I’ve some data sets that contain ~3 million data points, and yes a standard first pass is to do LOESS.
It would be nice to have a LOESS function in Excel — it’s more familiar and comfortable to some folks around here — rather than R. That’s why we were excited to come upon your solution. We do have some other ~20-30K datasets (and the above that I mentioned), but trusting Excel and XP to 30 minutes (or longer) of stable computing does seem to be living to close to edge for me!
Thanks for your excellent and informative blog.
David
Jon Peltier says
David –
Even though there are 385k input data points, you could output LOESS values for many fewer points, even just a thousand. This should cut down on most of the calculations.
DanF says
I particularly like the remember last use feature.
However, after a half day of LOESSing all over the place, I can’t get the utility to work any longer. When I click the x input range, I get the normal selection box. When I try to put a y range in or click any of the input buttons or text boxes, it goes poof and the LOESS window closes. When I close Excel (thinking that a good old fashioned close it-open it sequence is the cure-all for just about anything), I get the password requests. I read your REF CTL commentary, but I didn’t see what I might have done to cause LOESS to go on strike.
Jon Peltier says
Dan –
I have not yet changed the LOESS utility to use textbox/inputbox instead of the flaky RefEdit. When it works, the RefEdit is nice, but when it doesn’t work, it is horrible.
Thomas Rand-Nash says
First and foremost, THANK YOU!! This is coming in incredibly handy for smoothing out an unruly data horde! My question has to do with an “PTS_LOESS Password” box which opened after I quit excel. Is there a password I should know?
Thanks
Jon Peltier says
Thomas –
There’s no password you should know. Make sure you’ve installed all service packs and updates for the version of Office you’re running. If that doesn’t help, there’s some Registry diving that might help.
Nate says
Jon, I’m looking forward to trying this tool, but after installing it, I get the following error message when opening Excel 2007: “object library invalid or contains references to object definitions that could not be found”
Any ideas on what might cause that?
Nate says
Jon, regarding my comment on the missing object library: I determined that this was being caused by a corrupted installation and not your add-in. I reinstalled E2007 and have it working now.
Jon Peltier says
Nate –
Thanks for following up and reporting the fix. The error is more than likely due to the RefEdit issues I’ve discussed (Using RefEdit Controls in Excel Dialogs) and finally programmed away (Alternative to Excel’s Flaky RefEdit Control) in my commercial add-ins, but not the simple ones available with my blog posts.
Ann D says
I’m trying to load the Loess add-in, but when I click on “Click this PTS LOESS Smoothing Utility link to download the utility” I just get a bunch of garbely gook. Is the link still active?
Thanks.
Ann
Jon Peltier says
Hi Ann –
Weird. That just happened to me as well. Instead, right click on the link, and use Save As to save the file.
Ann D says
Thank you, John. Yes, that worked. Very cool utility and SO much friendlier than R.
Thank you for sharing it.
Ann
Lewis Mc says
I’ve been smoothing data by other tedious means for almost a year. Thank you for your help :)
Elizabeth Arias says
Just wanted to say thanks. I usually work in Stata, but am stuck working at home and needed to do some data smoothing. All I had access to was Excel…and there you were after a little searching. I downloaded the version for Excel 2007 and works “wicked awesome”!!!
DaleW says
Jon, great utility.
I would note that it still behaves oddly for me for really small N. For example, with that NIST data, try pushing it to N=3 resolution, and give it lots of resolution for output. (I know, it’s just *wrong* to use LOESS for linear interpolation.) But wait, why is it linearly interpolating, if jaggedly, when N=3? Linear interpolation implies N=2, right?
Jon Peltier says
Dale –
I notice the algorithm does something with the N values. Sometimes I’ll do a 3-month smoothing, and enter N=90. Depending on the total sample size and how alpha is rounded, the algorithm might actually use 89 or 91 instead of 90. This may be taking your N=3 and instead using N=2. Next time you run the routine, it shows the actual N used last time in the dialog.
I’ve been meaning to look at the code and try to enforce N instead of alpha, which makes more sense to me.
DaleW says
Jon, I noticed your algorithm sometimes tweaks N. However, for my example it kept reporting back N=3 while clearly doing a sort of linear interpolation for N=2 points locally instead of LSQ with N=3 locally.
BTW, I like how Minitab handles excessively low alpha in its LOWESS implementation. It falls back to pure linear interpolation, meaning it uses the nearest point in each direction if at all possible (instead of true nearest two points as LOESS perhaps should, and your code actually does when reported N=3).
Rogan says
Hi Jon,
Nice program, thanks for making it available. But …
It worked fine for the first few times; then I stopped to do something else, and then when I came back, the box always disappears when I try to do anything on it. Not just about once every 10 or 12 times, but always. Can’t get it to work at all. Even just accepting the data there and clicking OK does nothing. I’ve read your pages about RefEdit and tried everything there, without success. Only thing remaining is to throw the computer out the window.
Note that I also get Loess twice on the menu, and can’t fix this – not that it really matters.
You mentioned that you might replace RefEdit with text boxes or input boxes: have you made any progress here?
Thanks,
Rogan.
Jon Peltier says
Rogan –
Bizzarre. I wonder what may have gone awry. That utility still uses RefEdits, but this sounds like a different (or additional) problem.
Try this: Go to Tools > Add-Ins (or the Excel 2007 equivalent) and uncheck the box in front of the LOESS entry (or entries). Then restart Excel, go back to the Add-Ins dialog, and recheck (or browse to) the LOESS utility.
Rogan says
Hi Jon,
Thanks for your quick reply.
I had tried your suggestion, and did it again, just in case. Same result. (I should warn you that I am jinxed when it comes to electronics and computers. I don’t really believe in it myself, but, when I get close to any device, if anything can go wrong, it will. If a program can blow up, it will. I once wrote to Bill Gates about this (when I thought his software was at fault) and got a refund of my purchase price. But enough of that – it is my problem).
Sorry, I should have told you I am using Excel 2002. (I find 2007 excruciatingly slow; and 2010 just blows up on my machine, due to influences mentioned above). But I also tried all suggested remedies on Excel 2007, with the same result.
This is all a bit of a drag, because I cannot use your amazing interface; but I have taken your VBA code for the calculations, and got it working. Thanks.
I am now looking at allowing a 2nd order fit (as suggested by TV and others. Your response – some very nice pseudo-code plus the warning “You’ll have to figure out what to do with the weights” – was a good model. Just include the weights in each of the sums. EXCEPT: the algorithm assumes that the sum of the weights is 1; and when this is not so, it may change subtly).
Anyway, I’ll have it sussed within a day or two, and will post here the code to add to yours to allow the 2nd order as an option.
Rogan.
Rogan says
Hi Jon,
I wanted to do the 2nd order by using the worksheet function Minverse to solve the three simultaneous equations. But Minverse requires a range input, and this must be a range on a worksheet, and you cannot change anything on a worksheet from a UDF. (If any of this is wrong, or there are any tricks to work around it, I would love to hear.) Of course, it can be done by a sub, and maybe your interface calls a sub.
But, for the moment, I had to resort to an explicit solution. The code follows:
1. Replace the function declaration with:
‘ New function declaration to allow for 2nd degree
Public Function LOESS(x As Variant, y As Variant, xDomain As Variant, nPts As Long, Degree As Integer) As Double()
2. Add the following variable declarations:
‘ Variables for 2nd degree
Dim SumWtX3 As Double, SumWtX4 As Double, SumWtX2Y As Double
Dim R1 As Double, R2 As Double, R3 As Double, R4 As Double, R5 As Double, R6 As Double, R7 As Double, R8 As Double
3. Put the following code just before the comment “do the sums of squares”:
‘ Test for linear (Degree=1) or 2nd degree
If Degree = 1 Then
4. Add the following code between and the statement yLoess(iPoint, 1) = … and the final Next:
‘ 2nd degree polynomial: Degree is anything but 1
Else
SumWts = 0
SumWtX = 0
SumWtX2 = 0
SumWtX3 = 0
SumWtX4 = 0
SumWtY = 0
SumWtXY = 0
SumWtX2Y = 0
For i = iMin To iMax
SumWts = SumWts + weight(i) ‘S0
SumWtX = SumWtX + x(i, 1) * weight(i) ‘S1
SumWtX2 = SumWtX2 + (x(i, 1) ^ 2) * weight(i) ‘S2
SumWtX3 = SumWtX3 + (x(i, 1) ^ 3) * weight(i) ‘S3
SumWtX4 = SumWtX4 + (x(i, 1) ^ 4) * weight(i) ‘S4
SumWtY = SumWtY + y(i, 1) * weight(i) ‘T0
SumWtXY = SumWtXY + x(i, 1) * y(i, 1) * weight(i) ‘T1
SumWtX2Y = SumWtX2Y + x(i, 1) ^ 2 * y(i, 1) * weight(i) ‘T2
Next
‘ Combine S & T variables
R1 = SumWtX2Y * SumWtX2 – SumWtY * SumWtX4 ‘T2S2-T0S4
R2 = SumWtX2 * SumWtX4 – SumWtX3 ^ 2 ‘S2S4-S3^2
R3 = SumWtX * SumWtX4 – SumWtX2 * SumWtX3 ‘S1S4-S2S3
R4 = SumWtX2Y * SumWtX3 – SumWtXY * SumWtX4 ‘T2S3-T1S4
R5 = SumWts * SumWtX4 – SumWtX2 ^ 2 ‘S0S4-S2^2
R6 = SumWtX2Y * SumWtX – SumWtY * SumWtX3 ‘T2S1-T0S3
R7 = SumWtX * SumWtX2 – SumWts * SumWtX3 ‘S1S2-S0S3
R8 = SumWts * SumWtX2Y – SumWtY * SumWtX2 ‘S0T2-T0S2
‘ Can now calculate directly
yLoess(iPoint, 1) = ((R3 * R6 + R4 * R7 – R2 * R8) * xNow ^ 2 + (R4 * R5 – R1 * R3) * xNow + R1 * R2 – R3 * R4) / (R3 ^ 2 – R2 * R5)
End If
The second degree fit is better at the ends (where the 1st degree tends to be linear) and is more faithful to the peaks and troughs, as you would expect. (By the same token, it will also be more sensitive to outliers).
Now I’m going to try and write a dll for the 3rd and higher degrees (despite the comment I saw somewhere that this is against the original spirit of Loess. It will be interesting to see the results). But that will be in my favourite language, Fortran.
Hope this is useful,
Rogan.
Blake says
Jon,
I was curious if there is a way I can call this in VBA? I want to run a batch process on about 50 sets of data, and want to do the basic 3 Column: Shared X input and X output, Y input, Y output. I tried using your VBA code you posted, but it runs real, real slow for some reason, and isn’t giving the same results. Thanks!
Blake
Jon Peltier says
Blake –
I have not built an API for this add-in, so it cannot be called from another procedure.
Jon Peltier says
Andres –
I just tested the link, and it downloaded an add-in, that is, an Excel xla file. Right click on the link and do a Save As, so your browser doesn’t try to read the add-in.
andres says
thanks Jon!
andres
Dave Rents says
Jon, Thanks for this fantastic tool. Very easy to use. I was wondering if you have/or have plans to build in an interpolation function? I was hoping to use something of this nature for not only smoothing but future forecasting.
Thanks again
Dave
J Hey says
Very useful utility.
However I am having a problem that seems similar to what a couple others found.
If I use the addin extensively in a particular sheet, and I save the file and then come back later, when I open the addin again it will have values in the form. If I click in any of the form windows, or click on a different model, the applet closes down. The only form window I can alter is for ‘shared Xinput and X output’. In effect there is no way to use the utility in that worksheet again. uninstalling the addin and reinstalling does not help. Only if I copy all the data to a new sheet, then can I use the applet on it.
thanks
J. Hey
Claire says
Hi Jon,
Does this work with Office 2010?
Thanks,
Claire
Jon Peltier says
Claire –
Yes. this program works in Excel 2010 (and 2007, 2003,…)
Claire says
Thanks Jon.
Looks like a great utility. I have it in my addin panel in the options window of excel but still nothing shows up in the add-ins pane of the ribbon (unlike other add-ins I have installed). I wondered if this was a compatibility issue but from your reply I guess not. I’ll keep trying.
Thanks,
Claire
Jon Peltier says
Claire –
If you’ve installed the add-in correctly, you should see on the Add-Ins tab, a button entitled PTS Charts. Click on this, and it will drop down to show LOESS (and any of a handful of other PTS Charts add-ins available from this blog).
Claire says
Thanks. Works fine on home computer – maybe a anti-virus problem or something at work.
K. A. says
Thank you Jon for this wonderful utility.
I am a new bee here and sorry for the dumb question.
My X and Y sets of data are as follows. For X =55 the corresponding value Y is unknown. Could someone kindly explain to me ,how I could predict the Y value for X= 55 and all corresponding Youtput values for each Xinput values using this utility? Which buttons to use is not clear to me due to my limited knowledge. Can I predict the Youtput value for X=55 this way? Thank you so much answering.
KA.
X Y
0 466
1 441
2 440
3 449
4 417
5 430
6 447
7 451
8 487
9 417
10 392
11 399
12 408
13 388
14 396
15 389
16 403
17 414
18 412
19 414
20 419
21 454
22 448
23 444
24 444
25 460
26 478
27 476
28 461
29 491
30 479
31 478
32 473
33 475
34 460
35 463
36 463
37 422
38 441
39 378
40 361
41 362
42 385
43 388
44 381
45 367
46 383
47 389
48 386
49 400
50 411
51 422
52 433
53 421
54 429
55 ?
Jon Peltier says
K.A. –
First I plotted your data, then I ran the LOESS utility, using the top left button and an arbitrary 15 points in the analysis, to get a column of fitted values adjacent to the data values.
Then I put the desired X value into a cell, and reran the utility, again with 15 points. This time I used the first button in the second row, using the two columns of data in the first range selection box, and the two column range starting with the cell containing the desired X value. The fitted Y value appears next to this X value.
It looks like this:
K.A. says
Thank you so much Jon. I will try to get my head around it :).
Mehdi says
Hi Jon
Fantastic Job;
I was looking for something like this for ages and i got so excited when i saw your examples undertaken by LOESS, however, it didnt work for my data. Maybe i’m doing something wrong during introducing X,Y. I’ll be grateful if yo can look at my data.
How can i send you my file?
Jon Peltier says
Mehdi –
The program works okay on your data, but there are a couple important features in your data.
1. Your data should be sorted in order of increasing X values.
2. Your data seems to show two regions. There is a steep increase from 0 to to mid-50s, followed by a gradual increase from mid-50s to upper-60s.
There are only about 50 points in the initial steep region. Using the default setting of 0.3 for alpha means each output point uses 300 input points for the calculations, so the LOESS calculations don’t show much of the initial region. In fact, even using N=50 doesn’t show the full drop to zero at the start of the data.
You may want to investigate spline fitting for your data.
Bram says
Hi Jon,
Thank you for this very useful tool. I have used it succesfully to study time trends of various pollutants. However, for one pollutant I always get the error Runtime error 13: Type mismatch. I could not identify any difference with the other datasets that ran fine. Any thoughts?
Here’s the data:
2/13/2001 140
2/26/2001 129
3/5/2001 80
11/13/2001 23
3/8/2002 3
11/9/2002 138
12/18/2002 24
2/12/2003 110
2/3/2004 169
2/19/2004 12.2
2/27/2004 232
10/19/2004 28.1
10/28/2004 39
12/6/2004 4.89
1/10/2005 83.8
10/19/2005 4.14
11/10/2005 13.8
2/21/2006 23.8
3/1/2006 26.2
12/11/2006 7.4
2/23/2007 5.8
4/21/2007 2.9
9/24/2007 5
12/19/2007 5.7
1/24/2008 14.6
11/26/2008 26.3
12/16/2008 11.3
2/7/2009 2.6
3/5/2009 2.8
10/14/2009 21
12/8/2009 20
2/6/2010 24
10/7/2010 20
10/31/2010 47
2/17/2011 7.7
DaleW says
Bram – Your data ran fine for me from the Text Import Wizard. The early data has so much scatter that you might consider alpha=0.5, if you can get past the runtime error.
Bram says
Dale,
Thanks for your response. It seems like its working now.
Bram
Jason says
Hi Jon,
Let me just say thanks for putting together a great tool. It’s perfect for analyzing my data and bringing datasets to a common scale for comparison. However, after some use of the add-in it’s started to exhibit some instability. It launches fine and I can click in the “X Input” box, but if I click anywhere else on the interface it closes immediately. I’m currently on Excel 2010, but had a similar issue on 2003.
Have you ever seen that before or have any recommendations for a fix?
Thanks,
Jason
Jon Peltier says
Hi Jason –
I use this utility frequently, at least once per day, mostly in 2003, and I’ve never encountered any instability. Do you get an error message.? Does it happen on sheets on which you’ve already used the utility, or on sheets on which you haven’t used the utility, or both? Does it happen right after Excel opens, or after it’s been running for a while? Is the data completely numeric?
Jason says
Sorry for the redundant post… I just read through the comments and it seems that I’m not the only one experiencing the self closing fluke. I’ll use J Hey’s work around and copy and paste data from one sheet to the other for the time being.
Thanks again for putting the time into this utility!
Shirley says
Thanks for your instructions on dowloading the software, and again for you work on this dissertation saver.
I tried to use the loess utility and received a message similar to one of your other users: runtime error ‘6’ overflow. The solution to this problem wasn’t on this listserv, can you please help me to figure out reasons for getting this error message.
Thanking you in advance,
Shirley
Jon Peltier says
Shirley –
The problem is with your data. You have 635 input points, but only 5 distinct X values. This means that for large amounts of your data, there is no X variation. The moving regression cannot calculate a slope, because the data are aligned vertically and the sum of squares variation of X is zero. Dividing by zero then gives you an overflow (infinity). The formulation of the weighting factor exaggerates the problem.
If you use 100% of the data points, you can use the program, (50% still had an overflow). The LOESS result is slightly less interesting than simply looking at the averages.
Another thing: using the same X inputs and outputs means the program will calculate duplicate output values each time a duplicate X appears in the input range. Use a second table for the outputs, without the duplicate X values, to minimize calculation times.
Matt says
This is what I had been looking for for years. Once again, thank you very much Jon.
Will Steinhardt says
Hi Jon,
First off, thank you. The Add-In is wonderful.
Lately I’ve been using it to process many different columns of data within the same worksheet. I am working on a macro that will do this for me, but I am unsure of how to refer to the function with VBA.
I got as far as
Dim LOESSvar
LOESSvar = Application.Run(“MyAddin.xla!PTS_LOESS” [some list of arguments])
but I am having trouble with how to input the arguments. If I could just feed it the ranges, and the nPoints value, that would be ideal, but I can’t figure out how to do that. You can probably tell that I’m new to this. Any advice would be highly appreciated, and I apologize if that has already been addressed (I skimmed the comments, though, so if it was, it probably wasn’t in a way I understand, haha).
And because I can’t resist: Excel-lent work.
Will
Jon Peltier says
Will –
I didn’t expose the inner workings of the utility to other projects. It’s something I’ve got on the back burner, but the front burners are boiling over, so it’s not imminent.
I did modify the utility so it will accept one X input and one X output column and multiple Y input columns, and spit out multiple Y output columns. Saves a lot of time if you’re evaluating a lot of data with the same X values, like a set of time series measurements. It’s not yet clean enough to share with the world. It’s that back burner thing again.
Scott says
I use the LOESS function extensively, it is a very good smoothing function. Thank you for this excellent Add-in
I was wondering, this may be a stupid question, but is it possible to implement LOESS across 2 dimensions (X,Y,Z); i.e. smoothing for Z?
Jon Peltier says
Scott –
I have not tried using LOESS across two independent variables. I suppose it’s not really different from the one variable case: apply the weighting, carry out the moving regression, etc.
Scott says
Jon
Well It was a little more difficult than I first thought but I have implemented a 2-dimensional smoothing routine. I ended up basing this on the matrix equation for a linear (and 2nd order, I did both) least squares fit but used the Euclidean distance to locate the closest number of points to the point of interest and solved the linear (or 2nd order) equation for that point using the closest x-points. So the weighting is really performed by the choosing the closest x-points you want to use (I tried adding an additional weighting to these selected points but the influence of this seemed negligible). It works but can be a little flaky if too few points are chosen, I’ll try and post the code when I get a chance. Thanks for the inspiration!
Scott says
This is the core code I created, it’s not pretty but it works. I have not posted the whole project as I have many sub routines to sort my data and show a user form to allow selection, by the user, of various ranges and then write the results to a sheet. I ended up using an additional add-in for Matrix manipulation as I needed something that would sort arrays (not ranges), I found this one: http://finaquant.com/download/matrixvectorvba. Which also had additional Matrix functions which I used in the code, I couldn’t have done without it!
I may have made some mistakes with the maths, especially around applying the weights (I think I have done this wrong, but even without them it gives a good result) and finding Bopt (the dimensions of the arrays was confusing to debug) but the result looks as it should so it can’t be too bad!
Here is a quick summary:
I have the X, Y & Z values all in columns which I then create vectors from.
I then scale/normalise the X & Y so that I can deal with physical values in X & Y that are drastically different in value to allow me to find the distance and also to deal with negative values.
Then I can calculate the distance of all of the points from the point we are dealing with by: distance=sqrt(b^2+c^2), I then have a choice (on the userform) to use the weighting feature or not so I use select case to choose what calc to do.
Then I sort the distance vector in ascending order and choose the first ?-number of rows (depending upon how many points the user selected in the userform). The slick thing about the vector sort routine is that each of the rows that I pull out of the sorted vector has an index associated with it which refers back to the original position before the sort. So I use this index to then grab the original (physical) X, Y & Z values out of their respective vectors to work on the current point.
So now we have an array of X, Y & Z values that are the closest points to the one of interest and I need to fit a surface to these points that minimises the error.
The equation to perform a least squares fit using matrices: matrix least squares -> Bopt = (X’X)-1 * X’a
Bopt – is an array of optimal coefficients required to minimise the the residual error.
X – is a matrix of terms in this case x, y, x^2, y^2, x*y and 1 (1 for an offset value) for a 2nd order surface, but you could work it on what eqn you like.
a – is a matrix of our z values.
I then have an array of X & Y values and associated coefficients to create a new Z value from. Once the array is complete for all the points I then use some further code to write it to the sheet and format it.
The result is a smoother map than the original. I have done a comparison plot of original-Z vs smoothed-Z and the error between the two is minimal, but of course there is an error (which changes depending upon the number of local points that are chosen for the fit and the method; 1st or 2nd order) as we wanted to change the Z-values to smooth the data.
I should point out that I tend to deal with relatively small maps ~400-600 points and when I run this code on a full map of 600points it takes about 10secs to run and write the result (on an i5-core laptop). As the number of points get larger so to does the processing time and there is probably an upper limit where you could run out of memory as the arrays get larger.
FQ_MAT: this is a link to another VBA module which contains the finaquant functions (http://finaquant.com/download/matrixvectorvba) so anything FQ_MAT. is a function from finaquant. You’ll have to read the documentation from there to see exactly what each function does.
Here is the code:
Sub call_local_smooth_function()oldStatusBar = Application.DisplayStatusBar
Application.DisplayStatusBar = True
Application.StatusBar = "LocalFit Calculation Progress: " & VBA.Format(prog_ctr_perc, "0.0%") & " complete"
With Workbooks(origworkbook).Worksheets(regress_sheet)
prog_ctr = 0
num_new_y_points = UBound(y_new_val, 1)
num_new_x_points = UBound(x_new_val, 2)
total_new_points = (num_new_x_points) * (num_new_y_points)
Vinx = FQ_MAT.FQ_range_to_vector(.Range(.Cells(data_offset(0), data_offset(1)), Selection.End(xlDown))) '---get the address range of the orignal x axis on the new sheet
.Cells(data_offset(0), data_offset(1) + 1).Select
Viny = FQ_MAT.FQ_range_to_vector(.Range(.Cells(data_offset(0), data_offset(1) + 1), Selection.End(xlDown))) '---get the address range of the orignal y axis on the new sheet
.Cells(data_offset(0), data_offset(1) + 2).Select
Vinz = FQ_MAT.FQ_range_to_vector(.Range(.Cells(data_offset(0), data_offset(1) + 2), Selection.End(xlDown))) '---get the address range of the orignal z data on the new sheet
ReDim local_smooth_coeff_array(LBound(y_new_val, 1) To UBound(y_new_val, 1), LBound(x_new_val, 2) To UBound(x_new_val, 2), 1 To coeff_ubound_val)
min_close_points = min_points_entered - 1
'loop1 for new y values goes here
For ynew_i = LBound(y_new_val, 1) To num_new_y_points
'loop2 for new x values goes here
For xnew_i = LBound(x_new_val, 2) To num_new_x_points
'scale/normalise the x axis in relation to the current new x point so that locally close points to the new x can be found correctly
x_new_val_neg = x_new_val(1, xnew_i) * -1 'negate the new x val as the matrix routines only contain an addition
Vinx_norm = FQ_MAT.FQ_vector_scalar_add(Vinx, x_new_val_neg) 'take the new x val away from each original/measured x val
Vinx_norm = FQ_MAT.FQ_vector_operation(Vinx_norm, "abs")
Vinx_norm_max = 1 / FQ_MAT.FQ_vector_aggregate(Vinx_norm, "max") 'get the max value of the deltas
Vinx_norm = FQ_MAT.FQ_vector_scalar_multiply(Vinx_norm, Vinx_norm_max) ' multiply by 1/max delta
Vinx_norm = FQ_MAT.FQ_vector_operation(Vinx_norm, "^") 'square the normalised axis values for use later on
'scale/normalise the y axis in relation to the current new y point so that locally close points to the new y can be found correctly; _
'same actions as above
y_new_val_neg = y_new_val(ynew_i, 1) * -1
Viny_norm = FQ_MAT.FQ_vector_scalar_add(Viny, y_new_val_neg)
Viny_norm = FQ_MAT.FQ_vector_operation(Viny_norm, "abs")
Viny_norm_max = 1 / FQ_MAT.FQ_vector_aggregate(Viny_norm, "max")
Viny_norm = FQ_MAT.FQ_vector_scalar_multiply(Viny_norm, Viny_norm_max)
Viny_norm = FQ_MAT.FQ_vector_operation(Viny_norm, "^")
dist_vctr = FQ_MAT.FQ_vector_vector_sum(Vinx_norm, Viny_norm) 'add each squared value for x and y to each other
dist_vctr = FQ_MAT.FQ_vector_operation(dist_vctr, "sqr") ' perform the square-root of the addition distance=sqrt(b^2+c^2)
Select Case weighting_selected
'tricubic weighting function for use as LOESS smoothing (1-ABS(L12)^3)^3
' dist_vctr_w = FQ_MAT.FQ_vector_operation(dist_vctr, "abs")'this may not be needed as we do the abs prior to this operation
Case True
dist_vctr_w = FQ_MAT.FQ_vector_operation(dist_vctr, "^3") '(dist)^3
dist_vctr_w = FQ_MAT.FQ_vector_scalar_multiply(dist_vctr_w, -1) ' -(dist)^3
dist_vctr_w = FQ_MAT.FQ_vector_scalar_add(dist_vctr_w, 1) '1-(dist)^3
dist_vctr_w = FQ_MAT.FQ_vector_operation(dist_vctr_w, "^3") '(1-(dist)^3)^3
Case Else
dist_vctr_w = FQ_MAT.FQ_vector_scalar_multiply(dist_vctr, 0) 'set the vector to 0 ready to add 1 in the next operation; for no weighting just to get the correct size of vector
dist_vctr_w = FQ_MAT.FQ_vector_scalar_add(dist_vctr_w, 1)
End Select
' sort the vector to find the closet points to the new xy point to find the local points that are close -> SQR(ABS(x_val(i)-x_new_val)/MAX(x_val(i-n)-x_new_val)
Call FQ_vector_sort(dist_vctr, Vout:=dist_vctr_srtd, ind:=Vind_dist, SortOpt:=nAscending)
For num_close_points_i = 0 To min_close_points 'loop3 - create the X matrix & a vector using the closest number of points _
'by selecting the values from the arrays using the index (Vind_dist) from the sort (above) _
'need to combine the vectors into a matrix X=[x, y, x^2, y^2, x*y, 1] for matrix least squares eqn -> b = (X'X)-1 * X'a
Select Case excel_regress_frm.CheckBox4.Value 'choose the second or first order fit
Case True '2nd order X matrix VBA array(row,col)
ReDim Preserve x_mat_arr(0 To min_close_points, 0 To 5)
x_mat_arr(num_close_points_i, 0) = x_val(Vind_dist(num_close_points_i + 1) - 1) * dist_vctr_w(Vind_dist(num_close_points_i + 1))
x_mat_arr(num_close_points_i, 1) = y_val(Vind_dist(num_close_points_i + 1) - 1) * dist_vctr_w(Vind_dist(num_close_points_i + 1))
x_mat_arr(num_close_points_i, 2) = x_sqrd_val(Vind_dist(num_close_points_i + 1) - 1) * dist_vctr_w(Vind_dist(num_close_points_i + 1))
x_mat_arr(num_close_points_i, 3) = y_sqrd_val(Vind_dist(num_close_points_i + 1) - 1) * dist_vctr_w(Vind_dist(num_close_points_i + 1))
x_mat_arr(num_close_points_i, 4) = xy_val(Vind_dist(num_close_points_i + 1) - 1) * dist_vctr_w(Vind_dist(num_close_points_i + 1))
x_mat_arr(num_close_points_i, 5) = 1 * dist_vctr_w(Vind_dist(num_close_points_i + 1))
'a vector
ReDim Preserve z_vctr_arr(0 To min_close_points)
z_vctr_arr(num_close_points_i) = z_val(Vind_dist(num_close_points_i + 1) - 1) * dist_vctr_w(Vind_dist(num_close_points_i + 1))
Case False '1st order X matrix VBA array(row,col)
ReDim Preserve x_mat_arr(0 To min_close_points, 0 To 3)
x_mat_arr(num_close_points_i, 0) = x_val(Vind_dist(num_close_points_i + 1) - 1) * dist_vctr_w(Vind_dist(num_close_points_i + 1))
x_mat_arr(num_close_points_i, 1) = y_val(Vind_dist(num_close_points_i + 1) - 1) * dist_vctr_w(Vind_dist(num_close_points_i + 1))
x_mat_arr(num_close_points_i, 2) = xy_val(Vind_dist(num_close_points_i + 1) - 1) * dist_vctr_w(Vind_dist(num_close_points_i + 1))
x_mat_arr(num_close_points_i, 3) = 1 * dist_vctr_w(Vind_dist(num_close_points_i + 1))
'a vector
ReDim Preserve z_vctr_arr(0 To min_close_points)
z_vctr_arr(num_close_points_i) = z_val(Vind_dist(num_close_points_i + 1) - 1) * dist_vctr_w(Vind_dist(num_close_points_i + 1))
End Select
Next num_close_points_i 'next loop3 to generate each row of the X matrix and 'a' vector
'convert the arrays created above into FQ matrix and vector format
x_mat = FQ_MAT.FQ_var_to_matrix(x_mat_arr) 'if this is going to fall over it will likely be because of the type it needs to be double
x_mat_t = FQ_matrix_transpose(x_mat)
z_vctr = FQ_MAT.FQ_var_to_vector(z_vctr_arr) 'if this is going to fall over it will likely be because of the type it needs to be double
z_vctr = FQ_MAT.FQ_Vector_to_1DimMatrix(z_vctr, nVertical)
'perform a least squares fit using matrices: matrix least squares -> b = (X'X)-1 * X'a
'b are the coefficients required to minimise the the residual error
'X is a matrix of terms in this case x, y, x^2, y^2, x*y and 1 (1 for an offset value)
'a is a matrix of our z values
'Bopt is an array of optimal coefficients to minimise the errors for each new xy pair, Bopt = (X'X)-1 * X'a
Bopt = FQ_matrix_multiplication(x_mat_t, x_mat) '(X'X)
Bopt = FQ_matrix_inverse(Bopt) '(X'X)-1
Bopt = FQ_matrix_multiplication(Bopt, x_mat_t) '(X'X)-1 * X'
Bopt = FQ_matrix_multiplication(Bopt, z_vctr) '(X'X)-1 * X'a
'write the resultant coefficients into an array/vector/matrix to apply to the new xy value later in 'Write 3D data' macro
'z = A + Bx + Cy + Dx2 + Ey2 + Fxy -> ("x", "y", "x^2", "y^2", "x*y", "z", 1)
On Error GoTo more_points_needed
For coeff_i = 1 To coeff_ubound_val '4 or 6 for 1st or 2nd order becuase that's how many coefficients there are for the eqns:ax, by, cxy, d1 OR ax, by, cx^2, dy^2, ex*y and f1
local_smooth_coeff_array(ynew_i, xnew_i, coeff_i) = Bopt(coeff_i, 1)
Next coeff_i
'the coeff_array is applied in the 'write 3D data' macro. In this case the coeff array will contain one set of coefficients for each new x&y pair _
prog_ctr = prog_ctr + 1
' prog_ctr_perc = prog_ctr / total_new_points
Next xnew_i 'next loop2
' prog_ctr = prog_ctr + 1
prog_ctr_perc = prog_ctr / total_new_points
Select Case prog_ctr_perc
Case Is > 1
prog_ctr_perc = 1
Case Else
End Select
Application.StatusBar = "LocalFit Calculation Progress: " & VBA.Format(prog_ctr_perc, "0.0%") & " complete"
Next ynew_i 'next loop1
End With
more_points_needed:
Application.StatusBar = False
'Unload progress
Application.DisplayStatusBar = oldStatusBar
Erase x_mat_arr, z_vctr_arr
End Sub
Circe Verba says
Hi there,
I know it’s been a long time since this has been posted on how to. I have datapoints for my dissertation from an electron microprobe and I keep running into Run-time error 13 or 10 (Type mismatch or overflow). I can’t seem to get it to work properly. I am trying to use the beam location X which does include negative values (basically negative means move to the left/positive is right of origin). I’m suspecting perhaps this is the issue… ?
Here’s a small subset. Any ideas?
Spectrum Beam X (mm). Weight% Ca
Data point(1) -0.2393679
Data point(2) -0.2344325
Data point(3) -0.229497
Data point(4) -0.2233278
Data point(5) -0.2183923
Data point(6) -0.2134569 9.819213
Data point(7) -0.2072876 5.497916
Data point(8) -0.2023522 16.02173
Data point(9) -0.1974168 20.09677
Data point(10) -0.1912475 11.40429
Data point(11) -0.1863121 13.41207
Jon Peltier says
Possible sources of error:
– X data not sorted in increasing order (not a problem with the posted sample)
– Including rows with missing values
– Moving range too small (use 4 or greater)
Denny says
Jon,
I have to deal with many many pollution data from groundwater monitoring wells on a quaterly basis. I was wondering if this tool can help me to identify ‘ outliers’ in the time series data. Do you have suggestions on how to implement such an analyses?
Many thanks in advance!
Jon Peltier says
Hi Denny –
I don’t think this would be good for identifying outliers, since it’s good at smoothing widely varying data into a curve.
A better approach might be to use run charts. Track each well in its own chart, or group together wells with similar characteristics. The methodology to run charts is introduced in these pages:
Statistical Process Control
Denny says
Jon,
thanks for your answer. I did some chart analysis created with macros. But it would still be much work to run through all the graphs.
I was thinking of comparing the modelled data (Y) for a certain date (X) with the actual data and if there is a difference for example greater than the model data plus 2 or 3 times SD of the surrounding measurements I could assign these data points with a warning for further control and processing.
I found quite some literature about the problem of identifying outliers in time series data, but there are no common methods. I will look further…
HH says
Pro Tip: you can get almost identical smoothing results by taking taking a simple average of n observations (i.e. rows). You just have to offset the averaged block of values so that n/2 values are from rows above, and n/2 are from rows below.
For example, if you have data in rows A1:A1000 and you want to smooth across 50 observations to simulate your moving regression of n = 50, you would use the following formula in cell B25 : =AVERAGE(A1:A50)
Then just copy that formula down through B1000. Unfortunately, you do not get any values for B1 through B24, but otherwise it be virtually identical to running the LOESS function with n = 50. Plus, it runs several hundred times faster!
Jon Peltier says
Hadam –


Sure, a moving average is another way to smooth data.
LOESS is a moving linear regression. Same idea. But the linear regression provides a fitted value of Y at each X, so it is already a bit smoothed by this transformation.
The regression is weighted so that data closest to the X of value have more influence on the calculated Y than data farther from this X. This means that a point with a large deviation from the overall data has less effect, and its effect is limited to a smaller range of X.
Finally, LOESS provides an imperfect but consistent fit that extends to the endpoints of the input data.
I took the famous Playmate BMI data set (see Wired Relates Playboy Playmate BMI and Average BMI, 1954-2008 in Flowing Data, briefly mentioned in this blog in LOESS Smoothing in Excel) and applied a LOESS fit using 150 points (alpha=25%) and a 150-point centered moving average.
At the scale of the data points, which vary from about 15 to 24, the two fitting methods are similar, except for the ends of the fit where the moving average isn’t computed.
Hiding the data points and focusing on the two fits, we see that they are still close. For what it’s worth, the LOESS has a smoother appearance, and again, it extends to the limits of the data.
In terms of calculation speed, the two approaches are not a hundred times different. Using this utility, it takes less than a minute to fill out the dialog, and the calculations fill in the output range as soon as the OK button is pressed. It takes a similar amount of time to find the appropriate beginning cell for the moving average, enter the formula, then fill down to the appropriate ending cell.
BJ says
Hi Jon,
Thanks for making such a useful utility. I keep running into a problem that has been mentioned here a couple of times before, and I was wondering if you had any solutions. Whenever I try to use the LOESS utility in an Excel file that I haven’t worked with in a while, and if the X and Y input/output entries from an old operation for an old worksheet are still present, then the utility window automatically closes if I click anywhere within it. The only workaround I’ve found is to copy the entire worksheet to a new one and run the operation there, or to change the name of the worksheet to the old one being referenced in the utility. This is obviously a major nuisance, and I was wondering if you had any ideas on how to fix this. Thanks in advance.
– BJ.
Jon Peltier says
BJ –
I’ve only heard from a small number of users about this instability. I’ve never seen it myself, so I can’t really say what’s causing it.
I use this all the time, several times a day. The version of the add-in I use is the one in my latest chart utility, and I’ve put a few little added features into it. I don’t recall building in any special error-proofing, but it’s been several years since this blog post, so maybe I have.
sri dutta says
Hi Jon
I discovered your LOESS utility in Excel today. I’m working monthly trades and SP500 inde data with 6 years of data. No matter what alpha I use I simpy get a flat line for LOESS values. Any clues?
Sri
Jon Peltier says
What does your data look like? What alpha values are you using?
Dave Clarke says
Hi Jon,
I recently reinstalled Loess PTS add-in on a different machine (running Windows 7 and Excel 2010). When I check Options | add-ins, it is listed as an active add-in. I also see Add-Ins | PTS Charts menu commands, although for some reason there are two LOESS items.
I still get a “NAME?” error on my {loess(…) } arrays, even though these worked on my old computer. (BTW, the spreadsheet is an xls). Do I have to activate VBA or some such to get this going again? I’m baffled right now – I would love to get this going again, as I think this is a great smoothing tool.
{=loess(A2:A31, E2:E31, A2:A31, 20)}
is the formula in an array from b2:b31
Dave Clarke says
I am able to write new array formulae with loess(), so all is well.
Maybe I just need to reenter the formula on my old spreadsheet.
Jon Peltier says
Hi Dave –
Glad you figured it out. There is always an issue when an add-in is replaced, if it has cell functions. The workbook remembers the whole path to the add-in, not just the function name. Any little deviation, or even a gap when the add-in is not available, can spoil your week.
Sten Shao says
Hi, Jon,
Thanks for the function. It is great and help me a lot.
I am using the add-in to smooth the data in same sheet, but multip columns. For example, I have X data (time) in column A, measured Y data in column B, C, D, E, F, G and H. Could you please advice if there is a smiple way to do the work at one calcualtion? I have many data sheet, and need to proceed. It will take a lot of time to manual change Y data range and column.
Thanks in advance for your help.
Jon Peltier says
Hi Sten –
Glad you like the tool. I have an advanced version which is part of the Peltier Tech Chart Utility (https://peltiertech.com/Utility20/PeltierTechUtility.html). The major enhancement is that (a) the program remembers the parameters used in the last analysis on each worksheet, so if you add data to the worksheet you can repeat the same analysis with the new data, and (b) you can enter multiple ranges, for example, define column A as both sets of X values, B:H as the Y inputs, and I:O as the Y outputs. One visit to the dialog will smooth all of these sets of data, and tomorrow when you return to this worksheet, the same ranges will be prepopulated in the dialog.
Julian Opificius says
Jon, I am trying to reinstall your loess vba into Excel 2010 on Win7. I’ve used it successfully before on a previous (XP) machine with a previous version of Excel.
Running the script I get “Run-time error ‘6’: Overflow”. When I try to look at the script I am asked for a password.
Can you shed any light on either of these two problems?
Dan C says
Jon,
This looks really great but I can’t install it. in Excel 2010/Windows 7 it says “This workbook has lost its VBA project, ActiveX controls and any other programmability-related features” and doesn’t show up anywhere that I can see. In Excel 2003/Windows 7 it does show up on the menu (twice, in fact), and then no matter what the input, the output is always a single column of one number repeated. Even if I ask for two columns of output. What on earth am I doing wrong? Thanks.
Jon Peltier says
Dan –
That’s usually a sign of problems with your Excel installation. You might be able to try a repair/restore installation. Otherwise a full in/reinstallation may be needed.
Dan C says
Jon,
Wow, thanks for the really quick reply. Both copies of Excel were newly installed – same day for Excel 2003, last week for Excel 2010. Any other ideas?
Dan C says
It’s working! Thanks again. This is great.
Jorge says
Is there a limit to the number of observations that the Add-in can hold?
I’m working with close to 2,000 observations at the time and after waiting more than 45 minutes for the program to respond, I finally give up and restart excel. Any suggestions?
Thanks!
Jorge says
Nevermind… got it working perfectly. I was inputing the data incorrectly.
Thank you so much for making this Add-in available.
Jonathan K. says
Hey,
Thanks a lot for your work. I’ve tried to run the utility in excel 2013, I can activate it in the add-ins but then I don’t see anything related to PTS in the add-in toolbar… How to run the add-in?
Thanks!
Jon Peltier says
Jonathan –
It works fine in 2013. The menu stuff is treated strangely in 2013 though. I’ve fixed it and uploaded the fixed version. Download it and try again.
Bill Collinge says
Jon,
This is fantastic, and not the first cool thing I’ve seen on your blog. As nice as your plug-in is, I actually found myself using the UDF instead of the dialog box, because I’m used to using the keyboard (CTRL+SHIFT+arrow keys) for large ranges, and I couldn’t do that in the dialog (Excel 2013), and because I can subsequently extend the ranges when I get more data.
Still, it would be nice if the UDF reminded the user of the parameter options like the native Excel functions do. I suppose I could look into that. If you ever update this plug-in, that would be cool – but anyway, thanks!
Bill
Jon Peltier says
Bill –
If you select the first row of the data in the input boxes of the dialog, the program will look down to find the end of the range. I mention this between the 3rd and 4th dialog screenshot in the article.
Also, the parameters for the latest LOESS run on each worksheet are stored, so you can activate the worksheet, open the dialog, and the previous settings are populated in the dialog.
Bill Collinge says
Jeff,
Thanks, I missed that on the first point.
On the second point, I was referring to how the built-in Excel formulas will prompt you for parameters, e.g. =IF(logical_test…). I don’t know if UDFs can do that but that’s just because I haven’t looked. Thanks again.
Jon Peltier says
Bill –
Yes, that kind of hint can be built into a UDF. It used to be extremely difficult, and I haven’t looked to see if I can use the related improvements that have been built into Excel.
Mathieu says
Hi Jon,
Thanks for this great tool!
I’m attempting to run your loess code on some polling data. Unfortunately, some polls where carried out on the same date: I have 156 input points, and 139 distinct X values. Then, I always get the error Runtime error 6.
09-mars 27
12-mars 30
13-mars 28
16-mars 26,5
17-mars 30,5
19-mars 28
20-mars 28
20-mars 28
22-mars 29,5
24-mars 28
25-mars 26,5
25-mars 27
26-mars 27
27-mars 26
27-mars 27
…
How can I settle this problem?
Thanks
Jon Peltier says
Matthieu –
I found with your small sample that I got errors with 5 or fewer points in the analysis, but with 6 or more points there was no error. If I go into the code, I can make a minor adjustment to the weighting factor, essentially changing this
to this
The effect on calculated Y values where the code didn’t fail was in the level of ppm, but the code didn’t fail in the other cases. Since the weight factor is someone’s best guess at a useful function anyway, and the effect is minor, I’m incorporating it into future work on my commercial software. The simple utility here will not be updated.
CJ says
Hi, my apologies if this is a very basic question– but should the graphs be automatically generated from the utility? It worked for generating the Y output column, but I’m not sure how to graphically represent the LOESS curve data in Excel. (I am using Excel 2013). Thanks!
Jon Peltier says
The utility calculates the Y values for the X values provided. It’s up to you to add a series to the chart with these X and Y values. Make sure you’re using one of the XY Scatter chart styles, and not a line chart.
JL says
How may I use this to properly interpolate and smooth Age-Earnings Profiles in Excel? I typically have 10 data points, one every 5 years, from age 22 to 67.
Jon Peltier says
Jim sent me a sample of his data, and asked how he would smooth it, and also how could he extrapolate beyond the endpoints of the data. Here is my response to him, as an example of usage of this tool.
When you install this utility in Excel 2007 or later, a new ribbon tab appears, labeled Add-Ins, and it contains a new button, labeled LOESS.
Here is your data tabulated and charted. The X values are in column A, the Y values in B, and I’ve reserved column C for the outputs.
The simplest case uses the same X values for outputs, and simply puts the Y outputs in the column next to the Y inputs. Click the LOESS button on the Add-Ins tab, and use these settings in the dialog. Click the first button to use the layout as above (three columns, X, Yinput, Youtput). Select the first row of the data range in the selection box to the right (if you select the first row, the program will figure out how far down the data extends). Also, since you only have a handful of points, you need to use a larger alpha than 0.33, or you’ll get overflow errors (not enough points to compute a moving regression). I’ve used N of 5 instead of the default 3.
And here’s your output, which now includes the calculated Y values in the table and a line of the calculated Y values with the markers for the input Y values.
You don’t need to use the same X values for input and output. You asked about extrapolating below 21 and above 67, which you can do by picking a different range of X values for the output (make sure the extrapolated results are reasonable; extrapolation can be dangerous). In the example below I’ve kept your original data in columns A and B, I’ve added new X values for the outputs in column D, and I’ve reserved column E for the calculated Y values.
In the dialog I select the button that has separate input and output ranges, two columns each. For the inputs in the first selection box I enter A2:B2, the top row of the input data range, and for outputs in the second box I enter D2:E2, the first row of the output data range.
The result:
My commercial software includes an enhanced version of this LOESS smoothing:
– Input need not be sorted by increasing X
– Overflow errors are less common
– Dialog settings are saved in the worksheet and pre-populated when LOESS is repeated on the worksheet
JL says
Perfect Jon!
It does exactly what I need!
Works like a charm!
Jorge says
Hello Jon —
Is it possible to run the LOESS function from within a VBA UDF? I think I read in your blog an entry on this topic, but cannot find it again to see if it is possible or not. If so, what would be the syntax for the call? I have tried this, which produces a compiler error.
Application.Run “PTS_LOESS.XLA!Loess”, Serial, TC, Serial, LOESS_1, ActiveSheet.Range(“C2”)
Cheers!!
— Jorge.
Jon Peltier says
If you look in the Object Browser, you can see the syntax of the LOESS function:
Here X is the input X values (a range or an array), Y is the input Y values (range or array), xDomain is the output X values (range or array), nPts is the number of points in the moving regression, and the result is an array of calculated (LOESS-smoothed) Y values. I set a reference to the PTS_LOESS add-in, then used the following sub to compute values from the workbook and dump them into the workbook:
Jorge says
Many Thanks. This is most useful, especially for someone new to VBA as I am.
Questions: The expression Xin = ActiveSheet.Range(“P4:P28”).Value2 takes data from the Range and makes an Array from it? And the inverse expression ActiveSheet.Range(“S4:S28”).Value = Yout takes the internal Array and places the data into the Range? Is that what these expressions are intended for? So that the LOESS code can work internally with Arrays, instead of Ranges?
Thank you again, Jon!
Jon Peltier says
Jorge –
That’s correct. The code takes data from the sheet and puts it into the variant variables Xin, Yin, and Xout. I could have done it with ranges like this:
(I could declare these variables as ranges instead of variants, but it works either way.)
If I pass in ranges, the LOESS function converts them to arrays, and that’s what the code works on, the values in the arrays.
This line takes the value from the stated range and puts it into a 2D array in the Xin variant variable, without me having to tell it how many rows and columns to use.
Note that I do have to be more explicit in telling VBA how large the range should be where it puts the results.
Julian Opificius says
IJon, I’ve used this excellent utility several times in the past – thanks for your tireless work.
Today I’m using Excel 2003, revisting a file in which I used your utlity, and I find the Add-ins doesn’t show up. It used to, I’m absolutely sure.
I can’t find a definitive answer to this problem online. Do you know what is wrong and how I might fix it?
Julian Opificius says
I”m sorry, that wasn’t nearly specific or complete enough. When I re-open a file that has been processed with Peltier-LOESS, the Add-Ins directory is not visible. If I navigate to the Add-ins dialog the utility shows as available and enabled. I have to (pretend to) reinstall the xla by selecting Browse, which takes me to the directory in which PTS_LOESS is installed, select it, and click Open. I get a dialog saying that a file already exists in that location. I select replace, at which point the Add-Ins tab shows up again.
Closing and re-opening Excel hides the Add-Ins tab again, so I have to run through that process again.
The directory is in my list of trusted directories.
Jon Peltier says
Julian –
You’re only using Excel 2003, but I wonder if this is relevant:
https://peltiertech.com/Utility30/Documentation30/RibbonDisappears.html
Gio says
Hi, I can’t download the LOESS Utility. The browser returns an empty page. How can I download it, please? Thanks.
Jon Peltier says
Gio –
Right click on the link and choose Save Link (or similar, depending on your browser). This will save the file on your computer.
Michel says
I notice a bug in the utility where it dialog would disappear when entering data in the column address fields. This was also noticed by others on this blog. I realized this happens when the field description doesn’t have an existing spreadsheet tab. For instance, if I open the dialog and the column address fields refers to Sheet1, but Sheet1 no longer exists (e.g. renamed or deleted), then the utility would crash. I fixed the problem by creating a temporary Sheet1 sheet.
Paul Wildman says
This is broken in 2019 v Excel. You cannot even just open the file to save as the new .xlam format. During the session that I install the add-on, the GUI shows up but it get an “underflow” effort. The next session and the add-in doesn’t even show up.
Jon Peltier says
1. This is a very old add-in, as you can tell from its .xla extension. The feature was updated, error-proofed, and incorporated into Peltier Tech Charts for Excel. The advanced edition of Charts for Excel includes an option for a quadratic moving weighted regression to calculate the smoothed curve.
2. The add-in has to be unblocked prior to use, as described in Install an Excel Add-In. Right click on the file in Windows Explorer, choose Properties, and check the Unblock box at the bottom of the dialog. If the add-in is not unblocked, it will appear when first installed, but will not load when Excel restarts.
3. I can’t test in Excel 2019, but I’m using Office 365, which provides an even newer version of Excel. I am able to download and install the old .xla add-in without any warnings, and I can perform a LOESS smoothing on a data set.
4. At what point do you get the Underflow error? Is it while you are running an analysis? There may be a problem with your data: it should be sorted by X values, and it should not be comprised of many duplicated X values (e.g., dozens of values each for X=1, for X=2, etc.). I can look at your data if you’d like.
Frank Mlinar says
I have been working with Macintosh Swift, and have built my own data analysis program. I recently incorporated LOESS into the program and used polynomial regression analysis that I had previously programmed. Everything works.
A couple questions:
1. Your Excel program seems to use a first order regression. Is this true? I had read somewhere that LOWESS is considered first order, and LOESS is considered second order. (I can do any order within reason, or until my program blows up generally by giving inaccurate values)
2. When comparing LOESS to, say moving average, it seems that there are higher frequency terms included. The smoothing is more variable. What are the advantages to LOESS?
3. Regarding end points, I seems to me that the smoothing is less “accurate” as the weighting function becomes more one sided.
Jon Peltier says
Frank –
1. The LOESS implementation in the free add-in and in the “standard” edition of my commercial software uses a moving weighted first-order linear regression. The”advanced” edition of my software offers the option to use a moving weighted second-order linear regression. I didn’t realize LOWESS and LOESS differed in the degree of the regression; I thought they were just two different acronyms for the same calculations. Second order was much harder to program (I had trouble finding an algorithm that I could implement), but I was surprised that it really didn’t take longer to calculate. Probably most of the execution time is spent getting the data from Excel into VBA, then getting the calculations back into Excel.
2. Which has higher frequency terms? I’m not sure exactly what you mean. The moving average jumps up and down a lot more, and usually moving average is computed as a trailing indicator (it only averages points earlier than point of each average calculation). LOESS is a centered indicator which takes into account points on both sides of the data (except for point 3 below). LOESS also provides a smooth curve, not a jumpy track like moving average. Using a second order regression provides a curve which is closer to the variation in the data, sometimes to the extent that it also moves up and down a lot, though smoothly.
3. At the endpoints, a first-order regression LOESS approaches a straight line fit to the data, which must be what you are referring to. An advantage to using a second-order regression is that LOESS still recognizes curvature near the endpoints.
BCT says
Hi Jon,
sorry for this question if it’s blatantly obvious, but i can’t seem to find the link to download the LOESS utility. I am currently using the VBA code for your first version and it works great but i wanted to test the add-in if possible.
Jon Peltier says
Hi BCT –
A couple of years ago I removed the link to the free add-in. I had already included it in my commercial add-in. Peltier Tech Charts for Excel, and I have made many further enhancements to the algorithm, including internal sorting of the data, an option to use a moving weighted quadratic regression, improved error management, and a custom ribbon button. I didn’t want the older version floating around where the lack of these enhancements might lead to user errors, and I no longer wished to support such an old version.
BCT says
ahhh i see, good that means im not crazy or blind! thanks for the quick reply Jon and thanks for all the help you provide the community!