The report you submitted at the end of last year was well received. Your brilliant analysis was backed up by informative charts. Your boss, his boss, and the shareholders were all very impressed.
Now you have to update the chart to show year to date information, but you don’t want to generate all new charts. You also would rather not go through the hassle of copying data and pasting it into each chart, or worse, navigate the source data dialog umpteen times.
Here’s your old pal Jon with a time saving VBA routine to update your charts painlessly.
Last Year’s Report
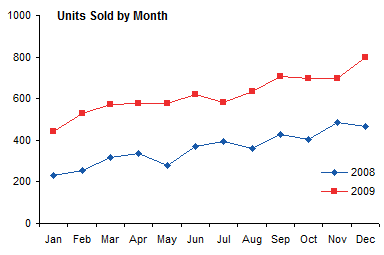
In your acclaimed report, you compared 2008 and 2009 monthly sales. Very nice, the generally increasing trend seen in 2008 continued in 2009. Must be a fine product.
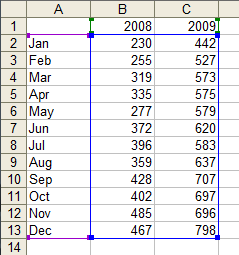
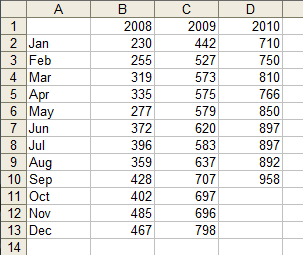
The data for this chart is in a simple table, shown below with the source data highlighted by selecting the chart.
The Interim Report
In the intervening months, sales data for 2010 has been generated, in the next column of the table. Now we have to add this data to the chart.
All that is needed is to select the chart and run the VBA procedure below. The code starts with the series formula of the last series in the chart:
=SERIES(Report!$C$1,Report!$A$2:$A$13,Report!$C$2:$C$13,2)which contains the series source data as follows:
=SERIES(Name,X_Values,Y_Values,Plot_Order)The code extracts the Y_Values argument, then depending on the orientation of this data, determines the next column or row of data to use for the Y values of a new series.
If the name of the existing last series was taken from the worksheet, then the corresponding cell in the next column or row will provide the name for the new series; otherwise, the generic name “Series N” will be used. The new series will use the same X values as the existing last series.
The code adds a new series with the old X values, the new Y values and series name, and a plot order one higher than the last:
=SERIES(Report!$D$1,Report!$A$2:$A$13,Report!$D$2:$D$13,3)Here is the resulting chart:
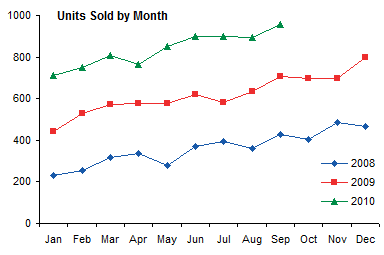
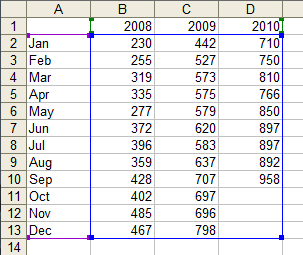
Awesome, monthly sales have followed the upward trend. When we select the chart, we can easily see that the source data now includes the range for the new series.
The code is listed below. It’s not too complicated, and includes a little bit of error handling in case you forgot to select a chart before running it, or in case the series formula of the last series cannot be parsed into something useful.
It’s common courtesy to give the user a meaningful explanation of why your code crapped out (or why they broke it):
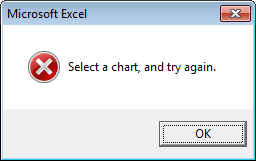
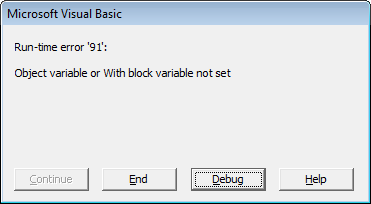
The alternative is ugly.
Sub AddSeriesToEnd()
  ' Add series to active chart
  ' Use same X values
  ' Use Name and Y values one column to right of last existing series
  Dim sFmla As String
  Dim iParen As Long
  Dim sFmlaArgs As String
  Dim vFmlaArgs As Variant
  Dim sMsg As String
  Dim iOffset As Long
  Dim jOffset As Long
  Dim rValues As Range
  Dim rName As Range

  If ActiveChart Is Nothing Then
    sMsg = "Select a chart, and try again."
    GoTo CantHandle
  End If

  With ActiveChart
    sFmla = .SeriesCollection(.SeriesCollection.Count).Formula
    iParen = InStr(sFmla, "(")
    sFmlaArgs = Mid$(sFmla, iParen + 1)
    sFmlaArgs = Left$(sFmlaArgs, Len(sFmlaArgs) - 1)
    vFmlaArgs = Split(sFmlaArgs, ",")

    If UBound(vFmlaArgs) + 1 - LBound(vFmlaArgs) <> 4 Then
      sMsg = "Series Formula too complicated to parse"
      GoTo CantHandle
    End If

    On Error Resume Next
    Set rValues = Range(vFmlaArgs(2))
    Set rName = Range(vFmlaArgs(0))
    On Error GoTo 0

    If rValues Is Nothing Then
      sMsg = "Last series values are not in a range"
      GoTo CantHandle
    End If

    If rValues.Rows.Count > 1 And rValues.Columns.Count = 1 Then
      ' series in columns, so offset 1 column
      jOffset = 1
    ElseIf rValues.Rows.Count > 1 And rValues.Columns.Count = 1 Then
      ' series in rows, so offset 1 row
      iOffset = 1
    Else
      ' one cell or multiple rows and columns
      sMsg = "Series values range cannot be parsed"
      GoTo CantHandle
    End If

    vFmlaArgs(3) = vFmlaArgs(3) + 1
    If Not rName Is Nothing Then
      vFmlaArgs(0) = rName.Offset(iOffset, jOffset).Address(True, True, xlA1, True)
    Else
      vFmlaArgs(0) = "New Series " & vFmlaArgs(3)
    End If
    vFmlaArgs(2) = rValues.Offset(iOffset, jOffset).Address(True, True, xlA1, True)

    sFmlaArgs = Join(vFmlaArgs, ",")
    sFmla = Left$(sFmla, iParen) & sFmlaArgs & ")"
    With .SeriesCollection.NewSeries
      .Formula = sFmla
    End With
  End With

ExitSub:
  Exit Sub

CantHandle:
  ' display generated error message
  MsgBox sMsg, vbCritical + vbOKOnly
  GoTo ExitSub
End Sub
If you’re not sure how to make use of this code, please read How To Use Someone Else’s Macro.


