Peltier Tech Charts for Excel
Custom Chart Types and Chart Formatting Tools for Microsoft Excel
New Version 4.0!
Peltier Tech has been busy upgrading the powerful Charts for Excel add-in. There are more custom chart types and functions available, and existing features have been enhanced. Read about it below.
If you are a user of an earlier version of Peltier Tech Charts for Excel, contact Peltier Tech for a coupon code so you can upgrade at a discount.
Custom Charts

Seven types of waterfall chart. Six different dot plots. Box plots and grouped box plots. Histograms, Paretos. Clustered and stacked column and bar charts. And much more.
Data and Formatting

Series formula editor to easily update chart data ranges: change rows and columns, even worksheets. Add a series using the row or column adjacent to an existing series. Make bulk changes to all series in a chart.
Label the last point in one or all series. Color data labels to match series formatting. Copy formatting from one series to another. Switch X and Y axes and/or data. Easily apply custom error bars. Move and resize elements within a chart. Unpivot a pivot chart, that is, convert it to a regular chart but maintain links to the pivot data.
Export Charts

Export one or more charts en masse or a worksheet range to an image file. Export one or more charts in one step to PowerPoint or Word. Windows only, not Mac.
Details
The same VBA add-in works in Windows and Mac. It’s easy to download and install. Your license allows installation on two computers, for example, your office desktop and the traveling laptop, or your work and home machines.
Read more details or get it here: Peltier Tech Charts for Excel.
Check out the documentation: Peltier Tech Charts for Excel Documentation Index.
Review the version history: Peltier Tech Charts for Excel Version History.
Jon’s Toolbox
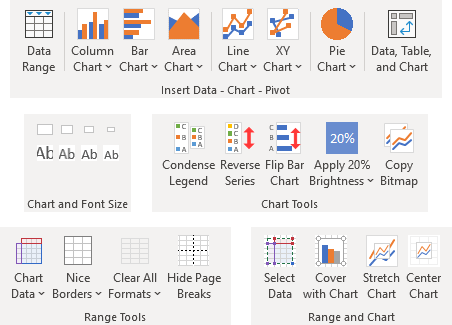
Quick tools to help with charting and formatting, for training, documentation, or writing.
Several handfuls of useful features. Insert data or charts quickly if you need to give a quick demo (during a class or conference call). Apply consistent chart sizes and font sizes to one or many charts. Tools for quick formatting of charts or data ranges.

Read more details or get it here: Jon’s Toolbox.
Check out the documentation: Jon’s Toolbox Documentation.
Review the version history: Jon’s Toolbox Version History.
Other Tools Under Development
Contact Peltier Tech for information about these projects.
Peltier Tech Charts for PowerPoint
The same suite of charting tools, running in PowerPoint. Create standard and custom PowerPoint charts using existing Excel data without tedious copying and pasting. Apply the same formatting directly in PowerPoint.
Chart Styles Manager
Develop chart styles that match your corporate signature details: colors, fonts, chart and font sizes, margins and spacing. Design up to three custom styles for different output purposes, for example: Twitter, Blog, and Printed Reports.
Under development by Peltier Tech and Policy Viz.


