Often data becomes available to us in formats other than Excel workbooks, such as CSV data files. A CSV (Comma-Separated-Value) file is a simple text file, with each row being a record, and the field values within each record are separated by commas; often the first row contains field names. Excel can open CSV files readily enough, and then you can work with the data like any worksheet data. But if you receive a lot of these files, it might be nice to have a VBA routine that will handle them for you.
A while back I wrote a couple of posts that showed how to plot data from CSV files (see links at end of this article). A reader had some issues implementing those techniques. They were complex approaches, one contained a dialog for the user to select columns to plot and the other was a full-blown add-in. I realized that I didn’t have a good introductory tutorial for opening and processing CSV files, so here it is.
I’ll start with a simple routine that opens a CSV file, saves it as an Excel workbook, then plots all the data in the file, letting Excel use whatever defaults it sees fit. Then I’ll show a few variations, to help you figure out how to work with your own special data.
Here is a zipped Excel workbook that contains all of this code, with buttons on the worksheet to run each routine. The zip file also contains a folder with a number of dummy CSV files.
VBA_Routines_to_Process_CSV_Files.zip
Simple CSV File – Open and Chart All CSV Data
I’ll use this simple CSV data. It has headers in the first row, X values in the first column, and Y values in the next three columns. Of course it doesn’t look like columns, since the values are separated by commas. But when opened in Excel, the data will be placed into columns.
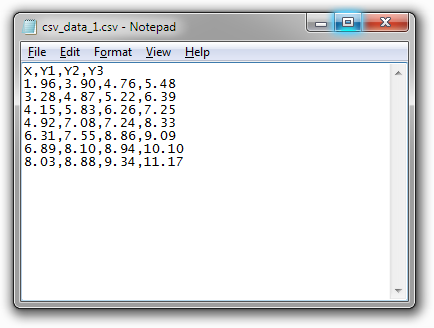
The code has to do these things:
- Open the CSV file
- Insert an XY Scatter chart
- Populate the chart with the applicable data
- Save the file with its chart as an Excel workbook
And here’s the simple code:
Sub CSV_OpenAndChart_1()
  ' declare variables
  Dim sCSVFile As String
  Dim sWorkbook As String
  Dim ws As Worksheet
  Dim cht As Chart

  ' hard-coded CSV filename
  sCSVFile = "C:\csv_data\csv_data_1.csv"
  ' workbook name: strip off everything after last "." and add "xlsx" extension
  sWorkbook = Left$(sCSVFile, InStrRev(sCSVFile, ".")) & "xlsx"

  ' open CSV file
  Workbooks.Open sCSVFile
  ' assign variables
  Set ws = ActiveSheet

  ' insert and populate chart
  Set cht = ws.Shapes.AddChart2(240, xlXYScatterLines).Chart
  cht.SetSourceData Source:=ws.Range("$A$1:$D$8"), PlotBy:=xlColumns

  ' move chart to left, under data, and make it smaller
  With cht.Parent
    .Left = 10
    .Top = ws.Range("$A$1:$D$8").Height + 10
    .Width = 275
    .Height = 200
  End With

  ' save as Excel Workbook
  ActiveWorkbook.SaveAs sWorkbook, xlWorkbookDefault

End Sub
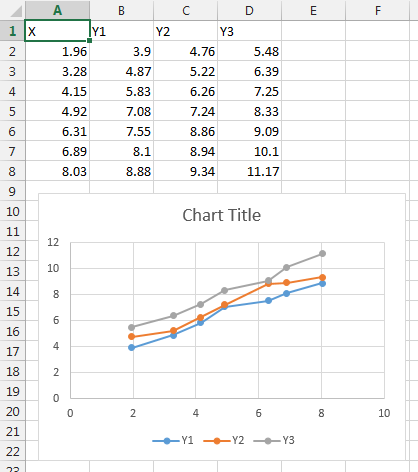
After the code runs, here’s what the Excel worksheet looks like. The data up at the top is no longer comma-separated, it’s arranged into rows and columns. And the chart is right below the end of the data.
Improvements
Before you even customize the code to accommodate any special features of your data, there are a couple of tricks that you ought to know about.
FileDialogFilePicker
In our procedure, the file name is hard-coded. I’m sure I don’t have to say why that’s a bad idea, except to say that you’re making a huge assumption that you’ve typed in the only file name that you’re ever going to need. And if the file isn’t there, well…
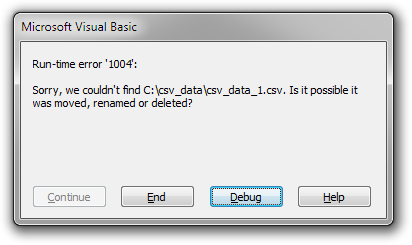
And you can’t just tell your users to type in a new file name in the code, because you can’t trust that they won’t break the code.
Using the file dialog isn’t much more difficult than hard-coding the file name. You need a few more variables and a few more lines of code:
  ' declare variables
  Dim fd As FileDialog
  Dim fdSelected As FileDialogSelectedItems
  Dim sInitial As String
  Dim sCurDir As String
  Dim sCSVFile As String

  ' initial folder to open in dialog
  ' if file name included, it is preselected
  sInitial = "C:\csv_data\csv_data_1.csv"
  sCurDir = CurDir

  ' create the dialog
  Set fd = Application.FileDialog(msoFileDialogFilePicker)
  With fd
    ' apply dialog settings
    .AllowMultiSelect = False
    .InitialFileName = sInitial
    .Filters.Clear
    .Filters.Add "CSV Files", "*.csv", 1
    .Title = "Select CSV File"

    ' show the dialog
    ' .Show returns -1 if Open, 0 if Cancel
    If .Show = 0 Then GoTo Exit_Procedure

    ' get the selected file
    Set fdSelected = .SelectedItems
    sCSVFile = fdSelected(1)
  End With

  ' clean up
  Set fdSelected = Nothing
  Set fd = Nothing

  Exit_Procedure:
  ChDrive sCurDir
  ChDir sCurDir
UsedRange
In the code, we can assign the value of a range variable as follows:
  Dim rUsed As Range
  Set rUsed = ws.UsedRange
The used range of a worksheet is the rectangular region that encloses all of the data. In our example, it’s A1:E8. Using UsedRange means I don’t need to know the address of the data range, and I don’t need to count how many rows or columns are in the data, I can just pass the used range to the chart.
Suppose my CSV data had more columns. My code using UsedRange doesn’t care, since it uses the whole used range of data in the file. The following starts with a CSV file with six columns instead of four, and all of the Y value columns are plotted.

AddChart2
In the procedure above I used the following to insert the chart:
Set cht = ws.Shapes.AddChart2(240, xlXYScatterLines).ChartHow did I know to use AddChart2? I can never remember the exact syntax, so I opened the CSV file and recorded a macro while I inserted the chart, and this is what the Macro Recorder recorded. That’s fine, AddChart2 gives us the nicely formatted charts which were introduced in Excel 2013. The 240 inside the brackets tell Excel to apply style 240, and of course xlXYScatterlines is the chart type. But Excel 2007 and 2010 don’t understand AddChart2: you’ll get a compile error, and Excel won’t even run any of the procedure. For these earlier versions of Excel, we need to use this code:
Set cht = ws.Shapes.AddChart(xlXYScatterLines).ChartNo style number, and you end up with the uglier default formatting, Even in Excel 2013 or 2016. For reference, the output of Excel 2007 and 2010’s AddChart is shown as the top chart below, with the output of Excel 2013 and 2016’s AddChart2 as the bottom chart below.
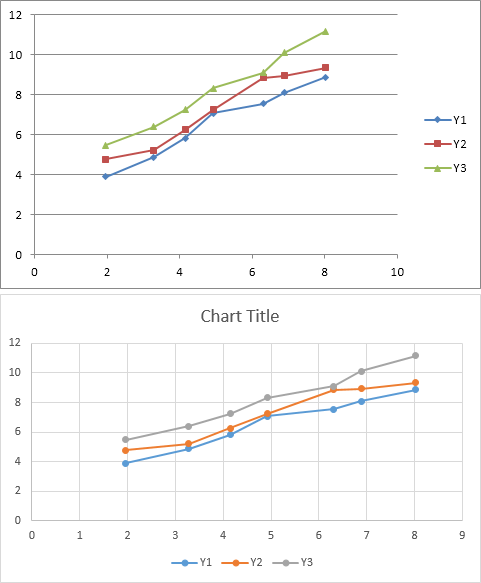
So how do you write code that does not crash in Excel 2007 and 2010, but still provides the nice chart styles of Excel 2013 and 2016? Excel 2013 and 2016 still can use AddChart, even though the preferred syntax is AddChart2, but you’ll get the uglier old formats. You can’t apply style 240 in the earlier releases, because it will not be recognized. So you need to test for Excel version, and apply the style in later versions.
  Set cht = ws.Shapes.AddChart(xlXYScatterLines).Chart
  If Val(Application.Version) > 14 Then
    cht.ChartStyle = 240
  End If
Application.Version returns a text string, for example, “12.0” for Excel 2007 or “16.0” for Excel 2016. We need to convert the string to a numerical value; this happens automatically if your system uses a period as a decimal separator, but it misbehaves if it expects a comma. Val(Application.Version) returns the numerical value, that is, 12 or 16.
Simple CSV File – Open and Chart All CSV Data – Enhanced Code
Here’s our simple procedure from before, incorporating the enhancedments described above:
Sub CSV_OpenAndChart_1A_FileDialog_AddChart()
  ' variables for File Dialog
  Dim fd As FileDialog
  Dim fdSelected As FileDialogSelectedItems
  Dim sInitial As String
  Dim sCurDir As String

  ' declare variables
  Dim sCSVFile As String
  Dim sWorkbook As String
  Dim ws As Worksheet
  Dim rUsed As Range
  Dim cht As Chart

  ' initial folder to open in dialog
  ' if file name included, it is preselected
  sInitial = "C:\csv_data\csv_data_1.csv"
  sCurDir = CurDir

  ' create the dialog
  Set fd = Application.FileDialog(msoFileDialogFilePicker)
  With fd
    ' apply dialog settings
    .AllowMultiSelect = False
    .InitialFileName = sInitial
    .Filters.Clear
    .Filters.Add "CSV Files", "*.csv", 1
    .Title = "Select CSV File"

    ' show the dialog
    ' .Show returns -1 if Open, 0 if Cancel
    If .Show = 0 Then GoTo Exit_Procedure

    ' get the selected file
    Set fdSelected = .SelectedItems
  End With

  sCSVFile = fdSelected(1)
  sWorkbook = Left$(sCSVFile, InStrRev(sCSVFile, ".")) & "xlsx"

  ' open CSV file
  Workbooks.Open sCSVFile
  ' assign variables
  Set ws = ActiveSheet
  Set rUsed = ws.UsedRange

  ' syntax for 2007-2010-2013-2016
  Set cht = ws.Shapes.AddChart(xlXYScatterLines).Chart
  If Val(Application.Version) > 14 Then
    cht.ChartStyle = 240
  End If
  cht.SetSourceData Source:=rUsed, PlotBy:=xlColumns

  ' move chart to left, under data, and make it smaller
  With cht.Parent
    .Left = 10
    .Top = rUsed.Height + 10
    .Width = 275
    .Height = 200
  End With

  ' save as Excel Workbook
  ActiveWorkbook.SaveAs sWorkbook, xlWorkbookDefault

Exit_Procedure:
  ChDrive sCurDir
  ChDir sCurDir

End Sub
CSV Data Structure: Skip First Column
Input data is not always (not usually, in fact) laid out for a simple input and chart routine. What if the first column of the CSV file is some kind of index or description. If we try to plot it, we will get a messy chart. So we want to skip the first column; using similar logic you can skip the first three columns, or the third column, or whatever data you don’t want in your chart.
Here’s a CSV file like the one used above, but the first column is an index.
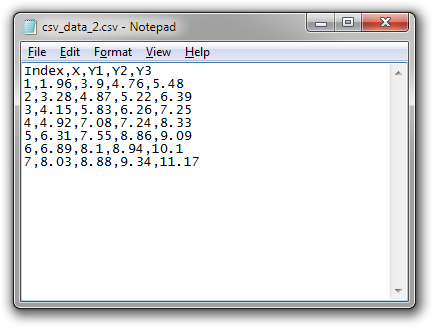
We’ll build on the previous routine, with its file dialog and AddChart/ChartStyle approach, and we’ll modify the chart data range.
Sub CSV_OpenAndChart_2A_SkipFirstColumn()
  ' declare variables
  Dim fd As FileDialog
  Dim fdSelected As FileDialogSelectedItems
  Dim sInitial As String
  Dim sCurDir As String
  Dim sCSVFile As String
  Dim sWorkbook As String
  Dim ws As Worksheet
  Dim rUsed As Range
  Dim cht As Chart

  ' variables to help modify chart data range
  Dim nRows As Long, nCols As Long
  Dim rChart As Range

  ' initial folder to open in dialog
  ' if file name included, it is preselected
  sInitial = "C:\csv_data\csv_data_2.csv"
  sCurDir = CurDir

  ' create the dialog
  Set fd = Application.FileDialog(msoFileDialogFilePicker)
  With fd
    ' apply dialog settings
    .AllowMultiSelect = False
    .InitialFileName = sInitial
    .Filters.Clear
    .Filters.Add "CSV Files", "*.csv", 1
    .Title = "Select CSV File"

    ' show the dialog
    ' .Show returns -1 if Open, 0 if Cancel
    If .Show = 0 Then GoTo Exit_Procedure

    ' get the selected file
    Set fdSelected = .SelectedItems
  End With

  sCSVFile = fdSelected(1)
  sWorkbook = Left$(sCSVFile, InStrRev(sCSVFile, ".")) & "xlsx"

  ' open CSV file
  Workbooks.Open sCSVFile
  ' assign variables
  Set ws = ActiveSheet
  Set rUsed = ws.UsedRange

  ' modified data range
  nRows = rUsed.Rows.Count
  nCols = rUsed.Columns.Count
  Set rChart = rUsed.Offset(, 1).Resize(, nCols - 1)

  ' syntax for 2007-2010-2013-2016
  Set cht = ws.Shapes.AddChart(xlXYScatterLines).Chart
  If Val(Application.Version) > 14 Then
    cht.ChartStyle = 240
  End If
  cht.SetSourceData Source:=rChart, PlotBy:=xlColumns

  ' move chart to left, under data, and make it smaller
  With cht.Parent
    .Left = 10
    .Top = rUsed.Height + 10
    .Width = 275
    .Height = 200
  End With

  ' save as Excel Workbook
  ActiveWorkbook.SaveAs sWorkbook, xlWorkbookDefault

Exit_Procedure:
  ChDrive sCurDir
  ChDir sCurDir

End Sub
After the code is run, the new workbook looks like the following. The chart is selected, and you can see that the first column of data is not highlighted as part of the chart’s data range.
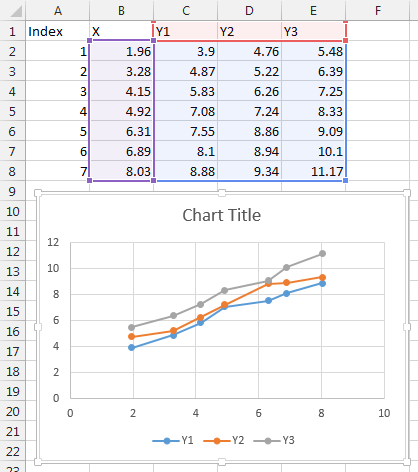
CSV Data Structure: Combine Date and Time Columns into Chart-Friendly Date-Time
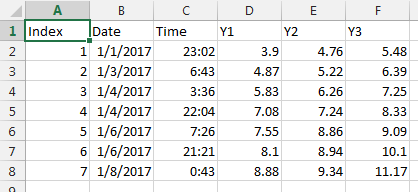
The previous data treatment was pretty easy. What if, instead of a nice column of X values, we have a column of dates and another column of times.
To review quickly, Excel treats a date as a whole number (the number of days since 1-Jan-1900, give or take an erroneous leap day, but that’s another story, and it’s not even Microsoft’s fault), and it treats a time as a fraction (the fraction of 24 hours that has elapsed since the previous midnight). You can’t plot by separate date and time values, but if you add them together you get a date-time value that can be treated as a numerical value on the X axis of a scatter chart.
So we need to insert a new column, and add the dates and times to get chart-ready date-time values. Here is a sample, shown for simpliciy in a worksheet rather than in a text file reader. Like the previous data set, the first column is an index which will be ignored by the chart. Columns B and C are the dates and times which must be combined in a new column inserted after column C.
Sub CSV_OpenAndChart_3A_CombineDateTime()
  ' declare variables
  Dim fd As FileDialog
  Dim fdSelected As FileDialogSelectedItems
  Dim sInitial As String
  Dim sCurDir As String
  Dim sCSVFile As String
  Dim sWorkbook As String
  Dim ws As Worksheet
  Dim rUsed As Range
  Dim cht As Chart

  ' variables to help modify chart data range
  Dim nRows As Long, nCols As Long
  Dim rChart As Range

  ' initial folder to open in dialog
  ' if file name included, it is preselected
  sInitial = "C:\csv_data\csv_data_3.csv"
  sCurDir = CurDir

  ' create the dialog
  Set fd = Application.FileDialog(msoFileDialogFilePicker)
  With fd
    ' apply dialog settings
    .AllowMultiSelect = False
    .InitialFileName = sInitial
    .Filters.Clear
    .Filters.Add "CSV Files", "*.csv", 1
    .Title = "Select CSV File"

    ' show the dialog
    ' .Show returns -1 if Open, 0 if Cancel
    If .Show = 0 Then GoTo Exit_Procedure

    ' get the selected file
    Set fdSelected = .SelectedItems
  End With

  sCSVFile = fdSelected(1)
  sWorkbook = Left$(sCSVFile, InStrRev(sCSVFile, ".")) & "xlsx"

  ' open CSV file
  Workbooks.Open sCSVFile
  ' assign variables
  Set ws = ActiveSheet
  Set rUsed = ws.UsedRange

  ' insert column to combine date (column 2) with time (column 3)
  ws.Columns(4).Insert xlToRight
  Set rUsed = ws.UsedRange
  nRows = rUsed.Rows.Count
  nCols = rUsed.Columns.Count
  With rUsed.Columns(4).Offset(1).Resize(nRows - 1)
    .Formula = "=B2+C2"
    .NumberFormat = "m/d/yyyy h:mm"
  End With
  Set rChart = rUsed.Offset(, 3).Resize(, nCols - 3)

    ' syntax for 2007-2010-2013-2016
  Set cht = ws.Shapes.AddChart(xlXYScatterLines).Chart
  If Val(Application.Version) > 14 Then
    cht.ChartStyle = 240
  End If
  cht.SetSourceData Source:=rChart, PlotBy:=xlColumns

    ' format axis tick labels
  cht.Axes(xlCategory).TickLabels.NumberFormat = "m/d"

  ' move chart to left, under data, and make it smaller
  With cht.Parent
    .Left = 10
    .Top = rUsed.Height + 10
    .Width = 275
    .Height = 200
  End With

  ' save as Excel Workbook
  ActiveWorkbook.SaveAs sWorkbook, xlWorkbookDefault

Exit_Procedure:
  ChDrive sCurDir
  ChDir sCurDir

End Sub
Multiple CSV Files, Processed Separately
If you get a dozen CSV files all at once, you could run the code a dozen times, selecting each file in turn. But wouldn’t it be better to select all the files in one trip to the file dialog, then let the code run all of the files?
You may have noticed the AllowMultiSelect property of the file dialog, and that we set its value to False. We can set this property to True, and the dialog will allow us to select multiple files using the Shift or Ctrl key as we’re used to. Each selected file will be a member of the file dialog’s SelectedItems. We can wrap the file-processing code in a For-Next loop to process each file in turn.
Note that if you select one file in the dialog, this routine will process that one file just fine.
Sub CSV_OpenAndChart_4A_MultipleFiles()
  ' declare variables
  Dim fd As FileDialog
  Dim fdSelected As FileDialogSelectedItems
  Dim sInitial As String
  Dim sCurDir As String
  Dim sCSVFile As String
  Dim sWorkbook As String
  Dim ws As Worksheet
  Dim rUsed As Range, rChart As Range
  Dim cht As Chart
  Dim nRows As Long, nCols As Long

  ' file counters
  Dim iFile As Long, nFiles As Long

  ' initial folder to open in dialog
  ' if file name included, it is preselected
  sInitial = "C:\csv_data\"
  sCurDir = CurDir

  ' create the dialog
  Set fd = Application.FileDialog(msoFileDialogFilePicker)
  With fd
    ' apply dialog settings
    .AllowMultiSelect = True
    .InitialFileName = sInitial
    .Filters.Clear
    .Filters.Add "CSV Files", "*.csv", 1
    .Title = "Select CSV File"

    ' show the dialog
    ' .Show returns -1 if Open, 0 if Cancel
    If .Show = 0 Then GoTo Exit_Procedure

    ' get the selected file
    Set fdSelected = .SelectedItems
    nFiles = fdSelected.Count
  End With

  ' do all the files
  For iFile = 1 To nFiles
    sCSVFile = fdSelected(iFile)
    sWorkbook = Left$(sCSVFile, InStrRev(sCSVFile, ".")) & "xlsx"

    ' open CSV file
    Workbooks.Open sCSVFile
    ' assign variables
    Set ws = ActiveSheet
    Set rUsed = ws.UsedRange

    ' insert column to combine date (column 2) with time (column 3)
    ws.Columns(4).Insert xlToRight
    Set rUsed = ws.UsedRange
    nRows = rUsed.Rows.Count
    nCols = rUsed.Columns.Count
    With rUsed.Columns(4).Offset(1).Resize(nRows - 1)
      .Formula = "=B2+C2"
      .NumberFormat = "m/d/yyyy h:mm"
    End With
    Set rChart = rUsed.Offset(, 3).Resize(, nCols - 3)

    ' syntax for 2007-2010-2013-2016
    Set cht = ws.Shapes.AddChart(xlXYScatterLines).Chart
    If Val(Application.Version) > 14 Then
      cht.ChartStyle = 240
    End If
    cht.SetSourceData Source:=rChart, PlotBy:=xlColumns

    ' format axis tick labels
    cht.Axes(xlCategory).TickLabels.NumberFormat = "m/d"

    ' move chart to left, under data, and make it smaller
    With cht.Parent
      .Left = 10
      .Top = rUsed.Height + 10
      .Width = 275
      .Height = 200
    End With

    ' save as Excel Workbook
    ActiveWorkbook.SaveAs sWorkbook, xlWorkbookDefault
    ActiveWorkbook.Close
  Next
Exit_Procedure:
  ChDrive sCurDir
  ChDir sCurDir

End Sub
Multiple CSV Files, Combined Into One Output Workbook
The final variation I’ll talk about here is processing multiple CSV files (and it works with just one CSV file), and placing each output worksheet into one output workbook; the worksheet tabs will reflect the names of the input CSV files. We’ll use an additional file dialog, the msoFileDialogSaveAs dialog, to ask the user for a filename for this output workbook.
Sub CSV_OpenAndChart_5A_CombineMultipleFiles()
  ' declare variables
  Dim fd As FileDialog
  Dim fdSelected As FileDialogSelectedItems
  Dim sInitial As String
  Dim sCurDir As String
  Dim sCSVFile As String
  Dim sWorkbook As String
  Dim wbOutput As Workbook
  Dim ws As Worksheet
  Dim rUsed As Range, rChart As Range
  Dim cht As Chart
  Dim nRows As Long, nCols As Long
  Dim iFile As Long, nFiles As Long

  ' initial folder to open in dialog
  ' if file name included, it is preselected
  sInitial = "C:\csv_data\"
  sCurDir = CurDir

  ' create the file dialog
  Set fd = Application.FileDialog(msoFileDialogFilePicker)
  With fd
    ' apply dialog settings
    .AllowMultiSelect = True
    .InitialFileName = sInitial
    .Filters.Clear
    .Filters.Add "CSV Files", "*.csv", 1
    .Title = "Select CSV File"

    ' show the dialog
    ' .Show returns -1 if Open, 0 if Cancel
    If .Show = 0 Then GoTo Exit_Procedure

    ' get the selected file
    Set fdSelected = .SelectedItems
    nFiles = fdSelected.Count
  End With

  ' open output workbook
  Set wbOutput = Workbooks.Add

  ' do all the files
  For iFile = 1 To nFiles
    sCSVFile = fdSelected(iFile)
    sWorkbook = Left$(sCSVFile, InStrRev(sCSVFile, ".")) & "xlsx"

    ' open CSV file
    Workbooks.Open sCSVFile
    ' assign variables
    Set ws = ActiveSheet
    Set rUsed = ws.UsedRange

    ' insert column to combine date (column 2) with time (column 3)
    ws.Columns(4).Insert xlToRight
    Set rUsed = ws.UsedRange
    nRows = rUsed.Rows.Count
    nCols = rUsed.Columns.Count
    With rUsed.Columns(4).Offset(1).Resize(nRows - 1)
      .Formula = "=B2+C2"
      .NumberFormat = "m/d/yyyy h:mm"
    End With
    Set rChart = rUsed.Offset(, 3).Resize(, nCols - 3)

    ' syntax for 2007-2010-2013-2016
    Set cht = ws.Shapes.AddChart(xlXYScatterLines).Chart
    If Val(Application.Version) > 14 Then
      cht.ChartStyle = 240
    End If
    cht.SetSourceData Source:=rChart, PlotBy:=xlColumns

    ' format axis tick labels
    cht.Axes(xlCategory).TickLabels.NumberFormat = "m/d"

    ' move chart to left, under data, and make it smaller
    With cht.Parent
      .Left = 10
      .Top = rUsed.Height + 10
      .Width = 275
      .Height = 200
    End With

    ' put into output workbook
    ws.Move After:=wbOutput.Worksheets(wbOutput.Worksheets.Count)
  Next

  ' delete blank first worksheet
  ' display alerts -> false to hide warning
  Application.DisplayAlerts = False
  wbOutput.Worksheets(1).Delete
  Application.DisplayAlerts = True

  ' create new file dialog
  Set fd = Application.FileDialog(msoFileDialogSaveAs)
  With fd
    ' apply dialog settings
    .InitialFileName = sInitial
    .Title = "Enter Output Workbook Name"

    ' show the dialog
    ' .Show returns -1 if Open, 0 if Cancel
    If .Show = 0 Then GoTo Exit_Procedure

    ' get the selected filename
    Set fdSelected = .SelectedItems
  End With

  sWorkbook = fdSelected(1)
  wbOutput.SaveAs sWorkbook, xlWorkbookDefault

Exit_Procedure:
  ChDrive sCurDir
  ChDir sCurDir

End Sub
Other Examples Using CSV Files on Peltier Tech Blog
VBA: A Simple Tool to Open a CSV File and Create Chart with Data Specified by User
This tutorial shows development of a VBA program to open a CSV file, save it as an Excel workbook, and let the user select which data to plot.
VBA: An Advanced Add-in to Open a CSV File and Create Chart with Data Specified by User
This tutorial shows development of an advanced VBA add-in to open a CSV file, save it as an Excel workbook, and let the user select which data to plot.


Andy says
Thanks for the post. :)
I have been playing with the Get and Transform features of Excel recently, after I saw this video introduction from Mr Excel: https://www.youtube.com/watch?v=vZSOpmg4ehw. And there was a post from Microsoft recently about some updates as well (https://blogs.office.com/2017/02/08/january-2017-updates-for-get-transform-in-excel-2016-and-the-power-query-add-in/ – the section on Enhanced “Combine Binaries” experience when importing from any folder.)
In a nutshell you can point Excel to a folder filled with csv files and it can import all of them into a single sheet. I tried it with the same data set you used and was able to generate the graph. Then if I changed the csv file all I needed to do was right click on the table and press refresh and it pulled in the updated data and updated the graph.
This may be a way to avoid the need for the VBA in some cases?
Steve Bayliss says
Great post as usual Jon!
Larry Kiser says
Thank you. This is my my homework for this weekend.
ExcelSemSegredo says
I loved the content, when I have some questions about excel, I run to the blog to get more content, I’m from Brazil and I love its tips.
Dennis says
Thank you very much, Jon. I have recently started working with VBA and text files. I found this post very helpful. It will form the basis of my future implementations of VBA and text files.
Have you posted a blog regarding a VBA that involves adding multiple sheets and corresponding charts using multiple CSV files with multiple categories associated with multiple dates?
Jon Peltier says
Dennis –
While this is an extension of the techniques described in this article, it goes beyond the level of such an article, into the realm of a VBA development project.
You need mechanisms to define the list of CSV files, and to deal with multiple categories and dates.