Question: Extract a Category Label for a Point
I came across a question in the Excel Reddit, Is there a way to select a chart series point and have the label name of that point be copied into a cell?
Answer 1: Chart with Simple Axis
The short answer is the following function: you get .XValues property of the series, which is an array of category labels, and find the element of the array for the particular point:
Function GetCategoryLabel(cht As Chart, iSrsNum As Long, iPtNum As Long) As String
  Dim srs As Series, vCats As Variant

  Set srs = cht.SeriesCollection(iSrsNum)
  vCats = srs.XValues
  GetCategoryLabel = vCats(iPtNum)
End Function
You call it like this, passing in the chart, series number, and point number:
Sub TEST_GetCategoryLabel()
  Dim s As String
  Dim cht As Chart, iSrs As Long, iPt As Long

  Set cht = ActiveSheet.ChartObjects(1).Chart
  iSrs = 1
  iPt = 3

  s = GetCategoryLabel(cht, iSrs, iPt)
  s = "Category Label for Series " & iSrs & " - Point " & iPt & ":" & vbNewLine & s
  MsgBox s
End Sub
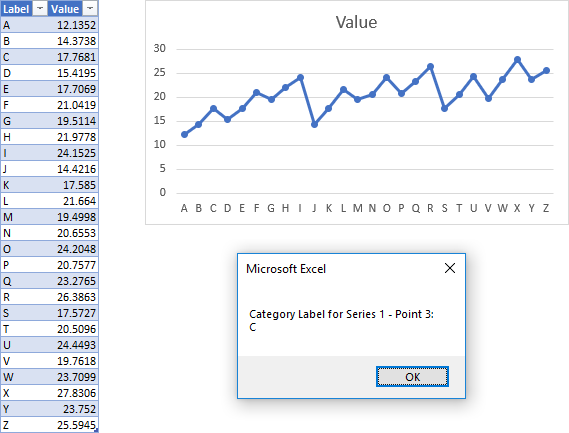
This doesn’t stick the label into a cell, like the question asked, but displays the label with a message box. As shown below, Series 1 – Point 3 has the label “C”:

Answer 2: Chart with Multi-Tier Category Labels
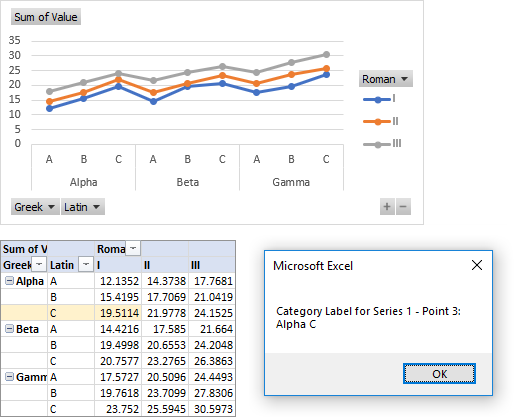
It turns out that the chart was a pivot chart, based on a pivot table with several fields in the rows area. Each field contributes a tier of labels to the category axis. The screenshot below shows a Table of data, a Pivot Table based on this Table, and above both a Pivot Chart, with a two-tiered category axis.

If you use the simple approach above, the .XValues don’t distinguish among the tiers, and the labels from different tiers are put together, separated by spaces. In the chart below, Series 1 – Point 3 has the compound label “Alpha C”, according to the simple algorithm.

We need a much more detailed VBA approach. We have to parse the series formula, get the address of the range containing the category labels, then get the corresponding range, figure out how many columns of labels there are, then find the label in each column corresponding to the point. This is complicated by the empty cells in the pivot fields, so we have to keep looking upward until we find a cell with a label.
Here is the more intricate function that extracts an array of category labels:
Function GetCategoryLabels(cht As Chart, iSrsNum As Long, iPtNum As Long) As Variant
  Dim srs As Series
  Dim sFmla As String, vFmla As Variant
  Dim rCats As Range, vCats As Variant, vOutput As Variant
  Dim iRow As Long, iCol As Long, nRows As Long, nCols As Long

  Set srs = cht.SeriesCollection(iSrsNum)

  sFmla = srs.Formula
  sFmla = Mid$(Left$(sFmla, Len(sFmla) - 1), InStr(sFmla, "(") + 1)
  vFmla = Split(sFmla, ",")

  Set rCats = Range(vFmla(LBound(vFmla) + 1))
  vCats = rCats.Value2

  ReDim vOutput(1 To UBound(vCats, 2))
  For iCol = 1 To UBound(vCats, 2)
    For iRow = iPtNum To 1 Step -1
      If Len(vCats(iRow, iCol)) > 0 Then
        vOutput(iCol) = vCats(iRow, iCol)
        Exit For
      End If
    Next
  Next

  GetCategoryLabels = vOutput
End Function
It’s called in a similar way:
Sub TEST_GetCategoryLabels()
  Dim v As Variant, i As Long, s As String
  Dim cht As Chart, iSrs As Long, iPt As Long

  Set cht = ActiveSheet.ChartObjects(1).Chart
  iSrs = 1
  iPt = 3

  v = GetCategoryLabels(cht, iSrs, iPt)

  s = v(LBound(v))
  For i = LBound(v) + 1 To UBound(v)
    s = s & ", " & v(i)
  Next

  s = "Category Labels for Series " & iSrs & " - Point " & iPt & ":" & vbNewLine & s

  MsgBox s
End Sub
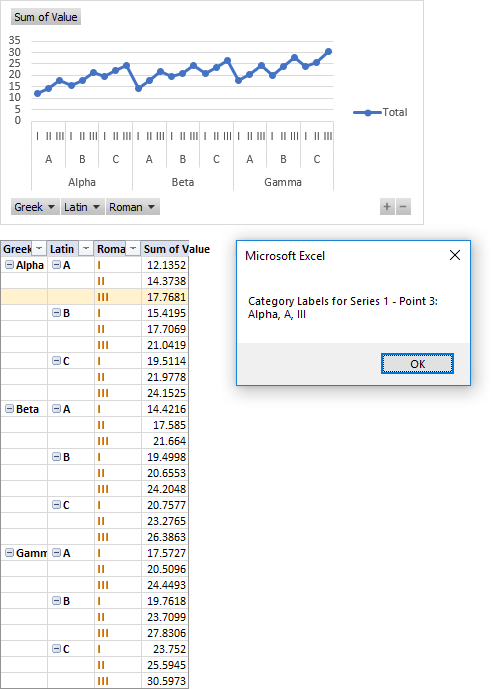
When we put all the category fields into the rows area of the pivot table, we get three labels for Series 1 – Point 3, “Alpha”, “A”, and “III”:

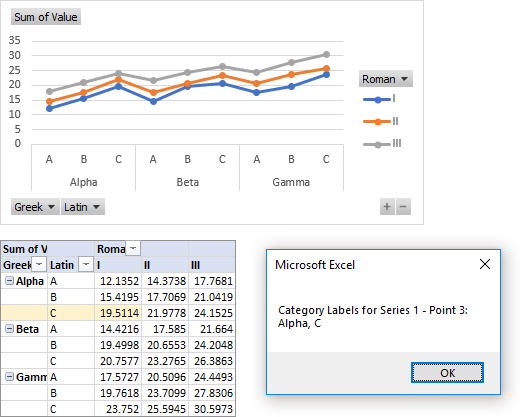
When we put the fields “Greek” and “Latin” into the rows area of the pivot table and move “Roman” to the columns area, we get two labels for Series 1 – Point 3, “Alpha” and “C”:

When we leave the field “Greek” in the rows area of the pivot table and put “Latin” and “Roman” to the columns area, we get a single label for Series 1 – Point 3, “Gamma”:


Charles Harris says
Hi
If I select a chart series and point, and place into a variable. Something similar to first code above. This code:
Set cht = ActiveSheet.ChartObjects(1).Chart
iSrs = 1
iPt = 3
will have to be changed to read the active point and get its series and number and then place in variable. I want to use the point together with the previous point to insert a line in a scatter, with no lines.
How do I do this?
Thanks
Charles
Jon Peltier says
Charles –
If the series is markers and no lines, applying a line format to point 3 will connect point 3 with the previous point, point 2.
Charles Harris says
Thanks Jon
How does vba know what the first point I have selected is? The point unknown until clicked by user
ChartObjects(1) what is the (1) is than an argument or refer to series1
Thanks
Charels
Charles Harris says
Hi
Apologies I forgot to mention in first message re selecting the point first.
The code looks great for inserting the line segment. Chart will have 2 or more chart line segments, using the macro each time.
How do I get the variables iSrs and iPt filled with the selected series an point
Charles
Thankyou
Downunder in New Zealand
Jon Peltier says
Charles –
I told VBA which chart, series, and point by using ChartObjects(1), SeriesCollection(iSrs), and Points(iPt).
I could have used ActiveChart to reference the chart selected by the user. Figuring out the series and point requires determining what the Selection is, and then doing some work on that.
Jon Peltier says
If you trust that a point is selected, you could just use:
Or maybe test it first:
Charles Harris says
Hi Jon
Thanks for that. I will try out over the weekend.
Thankyou
Charles