Frequently Asked Questions
What is Peltier Tech Charts for Excel?
Peltier Tech Charts for Excel 4.0 is an Excel add-in that enables users to easily create custom charts of types that are not native to Excel. The utility also includes some tools for modifying any charts, working with data, and other miscellaneous tasks.
The utility is a combination of most of Peltier Tech’s old Excel 2000-2010 chart utilities. It has several more chart types included. It also has a number of handy chart formatting features and other nice tools.
What operating systems will Peltier Tech Charts for Excel run on?
The utility runs on all versions of Windows that support Microsoft 365 (formerly Office 365) as well as Excel 2013, 2016, and 2019.
The utility will also run on any Mac that supports Microsoft 365, Excel 2016, and Excel 2019.
What versions of Excel will Peltier Tech Charts for Excel run on?
The utility runs on any version of Microsoft 365 (formerly Office 365) for Windows or Mac.
The utility runs on Excel for Windows versions 2013, 2016, and 2019.
The utility also runs on Excel 2016 and 2019 for Macintosh.
Will the utility run on 64-bit Excel?
The utility runs on 32- and 64-bit versions of Excel.
I bought your old utility. Do I need to pay full price for this upgrade?
If you have a valid license to any legacy Peltier Tech utilities, you are entitled to a discount. Email Peltier Tech and ask for a coupon code to apply at checkout. If you have already licensed the new utility at the regular price, email Peltier Tech and request a rebate.
My company wants to license Peltier Tech Charts for Excel for the whole office. Can we get a bulk discount?
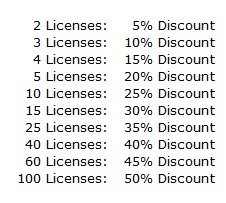
Of course. Peltier Tech offers bulk discounts starting with two licenses according to this schedule:

These discounts are automatically applied to your entire order when you enter the quantity in the shopping cart. If you need more licenses, email Peltier Tech for a custom quote.
Can I install Peltier Tech Charts for Excel on my other computers?
If you have a valid user license, you may install the utility on up to two computers, provided you are the primary user of the utility on both computers. This covers a desktop computer in your office plus a laptop for traveling, for example, or a computer in your office and another in your lab, or a work computer and a home computer.
Can I install Peltier Tech Charts for Excel on my co-worker’s utility?
No. Every user requires their own valid user license. You cannot install the utility on someone else’s computer unless they also have a valid user license.
How can I modify a chart made using Peltier Tech Charts for Excel?
Peltier Tech Charts for Excel makes unique charts based on regular Excel charts, with custom data layouts and combinations of chart types. But these are Excel charts, so they can be copied and pasted, edited, and reformatted using the familiar Excel buttons and commands. Note that careless editing can cause the chart to lose its special appearance.
If I make a chart using Peltier Tech Charts for Excel and send someone the workbook, do they need your utility to see the chart?
No. The Peltier Tech Utility makes unique charts based on regular Excel charts, with custom data layouts and combinations of chart types. As Excel charts, they can be copied and pasted, edited, and reformatted by anyone with Excel. Note that careless editing can cause the chart to lose its special appearance.
I discovered a bug. How should I report it?
Please email Peltier Tech, and provide full details about the bug. Tell us what you expected to happen, what you did to make it happen, and what happened instead. Indicate which versions of Windows and Excel you are using. If an error message appeared, please take a screenshot and attach it. The screenshot is more valuable than saying “Run-Time Error XYZ”, because the run-time error descriptions are much more informative than the run-time error numbers. If your data isn’t sensitive, or if you have an NDA for us to sign, please send a sample that produces the error.
Will you ever have my special chart type or feature?
Peltier Tech is always on the lookout for useful chart types and features to add to the utility. In fact, there is more in the development queue than is in the utility. But we will consider any reasonable suggestions. Note: an exploded, 3D, semitransparent donut chart is unreasonable.


