Chart VBA Samples
I answered a few questions on Stack Overflow this morning, and before I deleted the test workbook, I thought I’d share a few of the chart VBA procedures. All of these have to do with applying fill colors to Excel chart series.
Reverse Default Colors
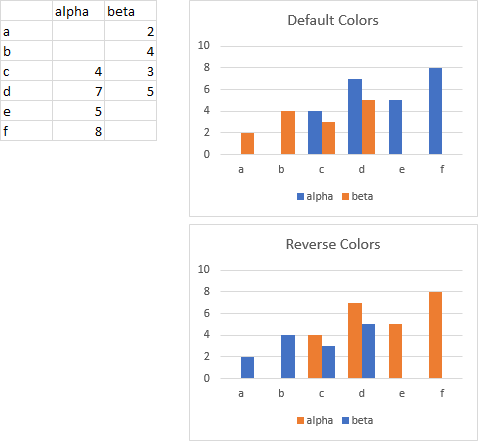
In the first example, from VBA Code To Change Fill Color Of Series On Chart, the user wanted to reverse the default colors in his chart. There were only three series, so it wasn’t too complicated.
His data looked like this, and the default chart color scheme is shown next to the data. The desired (reversed) color scheme is shown below the default: note that the last series is blue and the first is gray.

A further requirement is that, in case there are only two series, the second should be blue and the first orange.

And here is my simple chart VBA procedure for this:
Sub ReverseDefaultColors()
  Dim iSrs As Long, nSrs As Long

  If ActiveChart Is Nothing Then
    MsgBox "Select a chart and try again.", vbExclamation, "No Active Chart"
  Else
    With ActiveChart
      nSrs = .SeriesCollection.Count
      ' work backwards from last series
      For iSrs = nSrs To 1 Step -1
        Select Case nSrs - iSrs
          Case 0 ' last series
            .SeriesCollection(iSrs).Format.Fill.ForeColor.ObjectThemeColor = _
                msoThemeColorAccent1
          Case 1 ' next to last series
            .SeriesCollection(iSrs).Format.Fill.ForeColor.ObjectThemeColor = _
                msoThemeColorAccent2
          Case 2 ' etc.
            .SeriesCollection(iSrs).Format.Fill.ForeColor.ObjectThemeColor = _
                msoThemeColorAccent3
        End Select
      Next
    End With
  End If
End Sub
Format According to Performance
In the second example, from the same Stack Overflow post as above, the user wanted to color series based on series name. “On Time” should be medium green, “In Tolerance” should be light green, and “Late” should be red. We all know about red-green color vision deficiencies and that blue-orange is a preferred color scheme, but I mentioned that and still used red and green in my response.
Here is the desired outcome:

And here’s the chart VBA example:
Sub ColorGreenToRed()
  Dim iSrs As Long, nSrs As Long
  If ActiveChart Is Nothing Then
    MsgBox "Select a chart and try again.", vbExclamation, "No Active Chart"
  Else
    With ActiveChart
      nSrs = .SeriesCollection.Count
      For iSrs = 1 To nSrs
        ' only format series whose names are found
        Select Case LCase$(.SeriesCollection(iSrs).Name)
          Case "on time"
            .SeriesCollection(iSrs).Format.Fill.ForeColor.RGB = _
                RGB(0, 176, 80) ' Green
          Case "in tolerance"
            .SeriesCollection(iSrs).Format.Fill.ForeColor.RGB = _
                RGB(146, 208, 80) ' Light Green
          Case "late"
            .SeriesCollection(iSrs).Format.Fill.ForeColor.RGB = _
                RGB(255, 0, 0) ' Red
        End Select
      Next
    End With
  End If
End Sub
Reapply Automatic Colors
In the third example, from VBA Chart series set Color Fill to “Automatic”, the user often highlights some chart data, and would like an easy way to reapply the automatic colors. This is like clicking Automatic in the Format Data Series task pane. The way to do this is to reapply the default scheme colors.
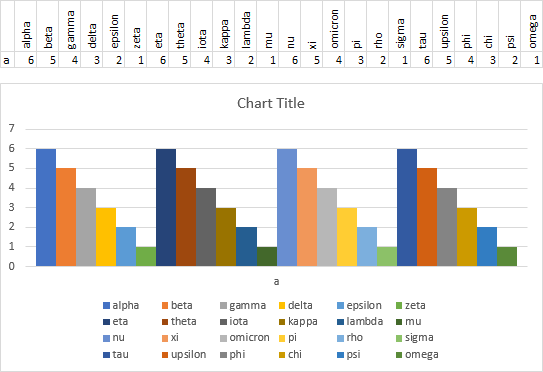
This shows how the colors appear for the first 24 series in a chart (coincidentally the number of letters in the Greek alphabet). There are six theme colors, denoted in VBA by the constants msoThemeColorAccent1 through msoThemeColorAccent6 (which resolve to 5 through 10 and which correspond in the default Office 2013/2016 theme as blue, orange. gray, gold, blue, and green). The first set of six series use these colors as is, the second set of six darken them considerably, the third set lighten them somewhat, and the fourth set darken them but not so much as the second set. Beyond 24 series, there are other shades, but by then the chart is so cluttered that we’ll just ignore them.

Here is my reply in Stack Overflow:
Sub ReapplyDefaultColors()
  Dim iSrs As Long, nSrs As Long
  Dim iThemeColor As MsoThemeColorIndex
  If ActiveChart Is Nothing Then
    MsgBox "Select a chart and try again.", vbExclamation, "No Active Chart"
  Else
    iThemeColor = msoThemeColorAccent1
    With ActiveChart
      nSrs = .SeriesCollection.Count
      For iSrs = 1 To nSrs
        .SeriesCollection(iSrs).Format.Fill.ForeColor.ObjectThemeColor = _
            iThemeColor
        iThemeColor = iThemeColor + 1 ' msoThemeColorAccent2, 3, 4, etc.
        If iThemeColor > msoThemeColorAccent6 Then
          ' recycle colors
          ' should also adjust brightness
          iThemeColor = msoThemeColorAccent1
        End If
      Next
    End With
  End If
End Sub
Well, I thought, we can use a little math to get the theme colors and brightness levels, so let’s modify the loop.
Sub ReapplyDefaultColors1()
  Dim iSrs As Long, nSrs As Long
  Dim iThemeColor As MsoThemeColorIndex
  Dim iBrightness As Double
  If ActiveChart Is Nothing Then
    MsgBox "Select a chart and try again.", vbExclamation, "No Active Chart"
  Else
    With ActiveChart
      nSrs = .SeriesCollection.Count
      For iSrs = 1 To nSrs
        iThemeColor = msoThemeColorAccent1 + (iSrs - 1) Mod 6
        Select Case Int(iSrs - 1) / 6
          Case 0
            iBrightness = 0
          Case 1
            iBrightness = -0.4
          Case 2
            iBrightness = 0.2
          Case 3
            iBrightness = -0.2
        End Select
        With .SeriesCollection(iSrs).Format.Fill.ForeColor
          .ObjectThemeColor = iThemeColor
          .Brightness = iBrightness
        End With
      Next
    End With
  End If
End Sub
And then, I thought of the deprecated but still available syntax for formatting charts from Excel 97-2003. Will the old .ColorIndex = xlAutomatic command still work with the new color system of Excel 2007-2016?
Sub ReapplyDefaultColors2()
  Dim iSrs As Long, nSrs As Long
  If ActiveChart Is Nothing Then
    MsgBox "Select a chart and try again.", vbExclamation, "No Active Chart"
  Else
    With ActiveChart
      nSrs = .SeriesCollection.Count
      For iSrs = 1 To nSrs
        .SeriesCollection(iSrs).Interior.ColorIndex = xlAutomatic
      Next
    End With
  End If
End Sub
As a matter of fact, it does.


Jason says
Hi,
I am trying to make excel do the same thing as your example Format According to Performance.
I duplicate your example Format According to Performance but not able to make the chart change color automatically base on the text name. Can I get a copy of your file or can you show me how to make excel change the bar chart color automatically linked to the text?
Jon Peltier says
Jason –
You have to select the chart and run the code manually.
Danie says
Need help,
If i have more than 1 chart / (difrerent chart), what is vba code still same?
What code if different?
Tks.