Chart Events
When you use a computer, you continuously interact with objects and programs, through events. An event is anything that happens, such as moving the mouse, clicking on objects, changing data, or activating windows. Programs can raise events of their own as well. A program can respond to events using event procedures. For example, if you click a scroll button, Excel responds by scrolling the window down.
As a programmer, you can write event procedures that will respond to (or trap) events by users. These event procedures can trap events in the worksheet, in the workbook, at the application level, or in a chart. In this article, I introduce you to chart event procedures in Microsoft Excel, which you can use for charts on a chart sheet and embedded charts.
Why Use Chart Events?
Chart events can make it much easier for people to use your programs, and add interactivity to your charts. Perhaps you need users to select a point in a series. If you create an event procedure that detects a click on the chart, users won’t have to type in a series name and a point number.
After the click the program can perform one or more useful tasks:
- Display a customized chart tip;
- Extract information from the chart and place it in a worksheet;
- Activate another chart or worksheet;
- Identify points to be included in a subsequent analysis.
Although Excel can accept data in a variety of formats and arrangements, you can do certain things with the data to ensure your charts are easy to build and maintain. “Good data” has these characteristics:
- Data for each series is arranged in Columns (preferable to Rows)
- First column is used for Categories (X axis labels)
- First row is used for Series Names
- Top left cell is blank
- Data below series names is numeric (right-adjusted with no alignment specified)
- There are no blank rows or blank columns within the data range
- There is a buffer row or column between the table and any other non-blank cells.
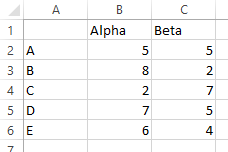
In this case, I use sample data similar to the above above to demonstrate chart event procedures.
Chart Sheet Events
The first set of examples is for charts that reside on their own sheets, not embedded in worksheets. These examples are contained in the downloadable workbook ChartSheetEvents.xlsm.
Create A Chart Sheet
Select the entire range you want included in your chart, or select a single cell within this range. If you followed guidelines 6 and 7 about Good Data, Excel selects the range of continuous data that includes the selected cell.
Select the data range, or a single cell within the data range. Press the F11 function key, to quickly create a chart sheet from the data range range, using the default chart type.
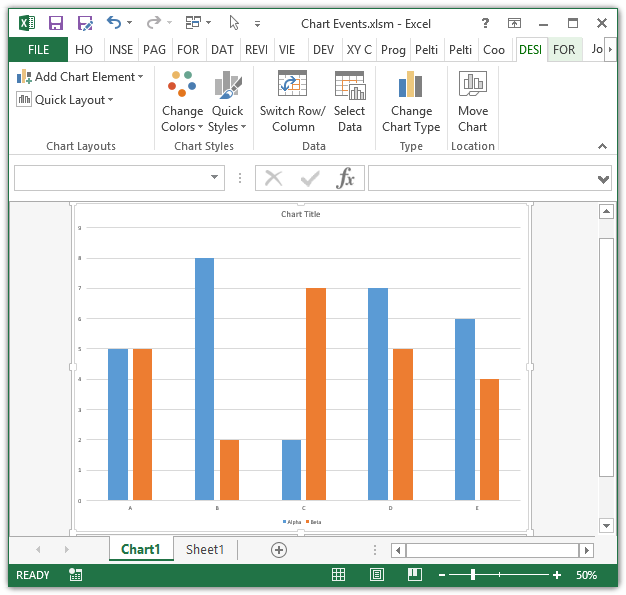
The Chart Code Module
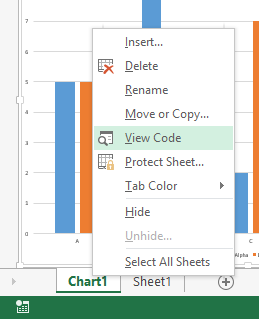
Right-click the chart sheet tab, and select View Code from the pop-up menu. This opens the Visual Basic Editor (VBE).
Within the VBE, a code module appears with the caption ChartSheetEvents.xlsm – Chart1 (code):

This is a special kind of code module, which is associated with the chart. Code contained in this module runs when events occur on the chart.
The code module should contain only the line
Option ExplicitThis line means any variable used in the module must be explicitly declared prior to use. This approach is slightly more work, but it assures that no errant variable will be accidentally defined by a typographical error.
If the module does not include the Option Explicit line, type it in, then go to the VBE’s Tools menu, select Options…, and on the Editor tab, check the Require Variable Declarations box. Every module you create after setting this option will automatically contain the Option Explicit line.
While you’re in the dialog, you may as well uncheck Auto Syntax Check, which pops up a dialog whenever you enter code with a syntax error. Since the code with an error is also colored red, there’s no need for an annoying dialog which you have to cancel to continue.
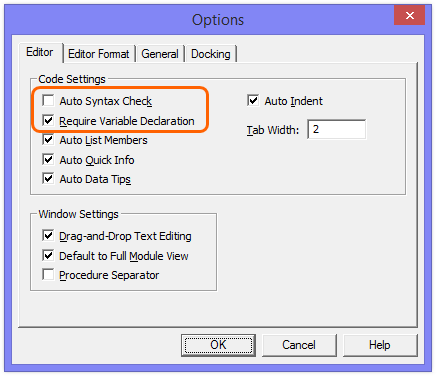
Chart Event Procedure
At the top of the code module, you see two dropdowns. One contains the items (General) and Chart, the other contains (Declarations). While you can type your entire event procedure from scratch, it’s easier to use these dropdowns when creating procedures.
Select Chart from the left hand dropdown. The following stub of an event procedure appears in the code module:

Private Sub Chart_Activate()

End Sub
This procedure runs whenever the chart is activated. Between these lines, type whatever code you want to be executed when the chart is activated. For example:
Private Sub Chart_Activate()
    MsgBox "Welcome to my Chart!"
End Sub
Now when you activate the chart, the following message box appears:
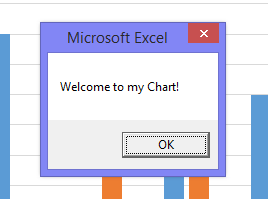
This example is demonstrated using the chart named Welcome in the companion workbook. This is just an example. Remove the message box code before it makes you insane.
More Chart Events
Chart_Activate is good for illustration of chart events, but other events can be much more useful. The chart events available to you are listed below. These can be accessed from the right hand dropdown in the chart code module when Chart is selected in the left hand dropdown.
- Activate
- BeforeDoubleClick
- BeforeRightClick
- Calculate
- Deactivate
- DragOver
- DragPlot
- MouseDown
- MouseMove
- MouseUp
- Resize
- Select
- SeriesChange
Next you can use an event to tell which chart element has been selected. Choose Chart from the left hand dropdown of the code module, then choose Select from the right hand dropdown, to produce the following procedure stub:
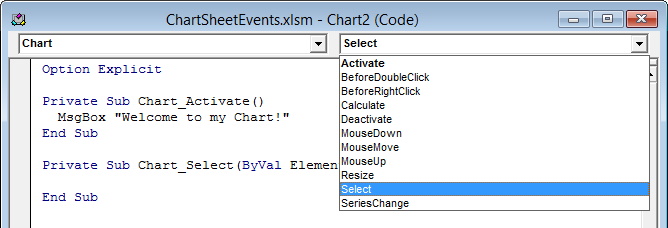
Private Sub Chart_Select(ByVal ElementID As Long, _
        ByVal Arg1 As Long, ByVal Arg2 As Long)

End Sub
Note that I’ve inserted the line continuation character (an underscore) in the first line to wrap the line at a convenient place.
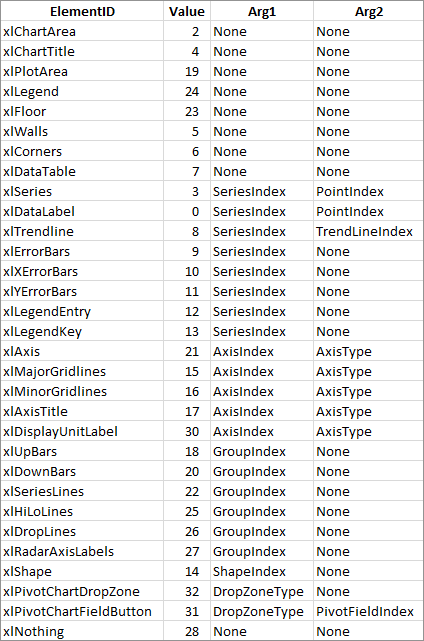
The Chart_Select event fires whenever a chart element has been selected. Three arguments are passed to the procedure: ElementID, which identifies the selected chart element, and Arg1 and Arg2, which provide additional information. For example, if ElementID identifies that a series has been selected, Arg1 identifies which series has been selected, and Arg2 identifies the point within the series which has been selected, or Arg1 = -1 to indicate that the entire series is selected. If Arg1 or Arg2 are not relevant to the selected ElementID, they are assigned the value zero.
When you select Chart from the left hand dropdown, the Chart_Activate procedure shell is created in the code module (Activate is the default event for a chart). You can ignore it, delete it, or use it for another purpose.
This table lists the ElementID values, and the meanings of their associated Arg1 and Arg2 parameters.
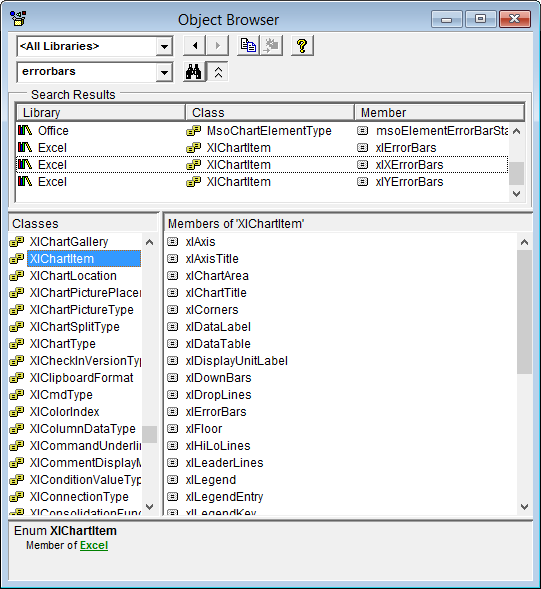
No need to memorize the details, since the VBE Object Browser (VBE View menu > Object Browser) knows everything.
Now you can add a line to the procedure to identify which chart element has been selected, and show the values of its associated arguments:
Private Sub Chart_Select(ByVal ElementID As Long, _
        ByVal Arg1 As Long, ByVal Arg2 As Long)

    MsgBox "Element: " & ElementID & vbCrLf & "  Arg 1: " & Arg1 _
        & vbCrLf & "  Arg 2: " & Arg2

End Sub
To test your event procedure, select the chart’s title. Click OK in the message box, and then test your event procedure with other elements, such as a series, and a point in a series.
The following three message boxes appear when selecting the Chart Title (ElementID = 4), Series 1 (ElementID = 3, Arg1 = 1, and Arg2 = -1), and Series 1 Point 4 (ElementID = 3, Arg1 = 1, Arg2 = 4). To select an individual point, you must single click twice: once to select the entire series, then again to select the point.
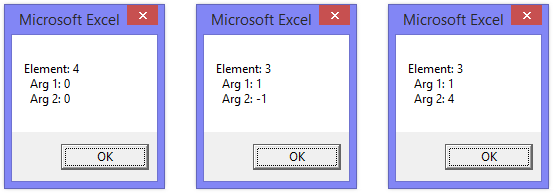
This example is demonstrated using the chart named Select in the companion workbook.
These message boxes aren’t very informative – text descriptions would be more useful. Replace the Chart_Select event code with the following more extensive procedure. It converts the values to text, and creates a more informative message:
Private Sub Chart_Select(ByVal ElementID As Long, _
        ByVal Arg1 As Long, ByVal Arg2 As Long)

    Dim sElement As String
    Dim sArg As String

    Select Case ElementID
        Case xlChartArea
            sElement = "Chart Area"
        Case xlChartTitle
            sElement = "Chart Title"
        Case xlPlotArea
            sElement = "Plot Area"
        Case xlLegend
            sElement = "Legend"
        Case xlFloor
            sElement = "Floor"
        Case xlWalls
            sElement = "Walls"
        Case xlCorners
            sElement = "Corners"
        Case xlDataTable
            sElement = "Data Table"
        Case xlSeries
            sElement = "Series " & Arg1
            If Arg2 > 0 Then sArg = "Point " & Arg2
        Case xlDataLabel
            sElement = "Data Label"
            sArg = "Series " & Arg1
            If Arg2 > 0 Then sArg = sArg & ", Point " & Arg2
        Case xlTrendline
            sElement = "Trendline"
            sArg = "Series " & Arg1 & ", Trendline " & Arg2
        Case xlErrorBars
            sElement = "Error Bars"
            sArg = "Series " & Arg1
        Case xlXErrorBars
            sElement = "X Error Bars"
            sArg = "Series " & Arg1
        Case xlYErrorBars
            sElement = "Y Error Bars"
            sArg = "Series " & Arg1
        Case xlLegendEntry
            sElement = "Legend Entry"
            sArg = "Series " & Arg1
        Case xlLegendKey
            sElement = "Legend Key"
            sArg = "Series " & Arg1
        Case xlAxis
            sElement = IIf(Arg1 = 1, "Primary ", "Secondary ")
            sElement = sElement & IIf(Arg2 = 1, "Category ", "Value ")
            sElement = sElement & "Axis"
        Case xlMajorGridlines
            sElement = IIf(Arg1 = 1, "Primary ", "Secondary ")
            sElement = sElement & IIf(Arg2 = 1, "Category ", "Value ")
            sElement = sElement & "Major Gridlines"
        Case xlMinorGridlines
            sElement = IIf(Arg1 = 1, "Primary ", "Secondary ")
            sElement = sElement & IIf(Arg2 = 1, "Category ", "Value ")
            sElement = sElement & "Minor Gridlines"
        Case xlAxisTitle
            sElement = IIf(Arg1 = 1, "Primary ", "Secondary ")
            sElement = sElement & IIf(Arg2 = 1, "Category ", "Value ")
            sElement = sElement & "Axis Title"
        Case xlDisplayUnitLabel
            sElement = IIf(Arg1 = 1, "Primary ", "Secondary ")
            sElement = sElement & IIf(Arg2 = 1, "Category ", "Value ")
            sElement = sElement & "Axis Display Unit Label"
        Case xlUpBars
            sElement = "Up Bars"
            sArg = "Group Index " & Arg1
        Case xlDownBars
            sElement = "Down Bars"
            sArg = "Group Index " & Arg1
        Case xlSeriesLines
            sElement = "Series Lines"
            sArg = "Group Index " & Arg1
        Case xlHiLoLines
            sElement = "High-Low Lines"
            sArg = "Group Index " & Arg1
        Case xlDropLines
            sElement = "Drop Lines"
            sArg = "Group Index " & Arg1
        Case xlRadarAxisLabels
            sElement = "Radar Axis Labels"
            sArg = "Group Index " & Arg1
        Case xlShape
            sElement = "Shape"
            sArg = "Shape Number " & Arg1
        Case xlNothing
            sElement = "Nothing"
    End Select

    MsgBox sElement & IIf(Len(sArg) > 0, vbCrLf & sArg, "")
End Sub
Test your new code, by selecting elements in the chart. Here are the revised message boxes, made more informative by analyzing the ElementID and other arguments:

This example is demonstrated using the chart named Nicely Select in the companion workbook.
This is a more useful procedure, because it tells us in human words what has been selected. On the other hand, it is less useful than it could be, because it pops up a message box every time a new chart element is selected, forcing the user to clear the message box before proceeding.
Identify the Point Clicked By the User
Another useful event procedure tells you which point was clicked on, and display its values. Chart_Select is not the best event to trap to detect clicking on a point, because two Chart_Select events must occur when a point is selected: the series is selected by the first click, and the point by the second. The MouseUp event is a better event to trap.
To create a new event procedure, choose Chart in the left dropdown and MouseUp in the right, to create this shell:
Private Sub Chart_MouseUp(ByVal Button As Long, ByVal Shift As Long, _
        ByVal x As Long, ByVal y As Long)

End Sub
Four arguments are passed to this procedure.
Button tells which mouse button was released: xlNoButton, xlPrimaryButton (usually the left button), xlSecondaryButton (right button), or xlMiddleButton.
Shift tells which keys are depressed when the mouse button was released. The value of Shift can be one or a sum of several of the following values:

For example, if Shift = 2, the CTRL key was depressed when the mouse button was clicked; if Shift = 5, both the SHIFT and ALT keys were depressed.
The coordinates of the cursor, x and y, are in chart object client coordinate units. It’s not necessary to be concerned about these, since you just pass them along to other functions to get more useful information.
Test the following event procedure, which uses Chart_MouseUp to determine where the mouse click occurred. The procedure:
- traps the release of the button,
- determines where on the chart the click occurred (x, y),
- passes these coordinates to the GetChartElement function to determine what chart element is located at these coordinates,
- determines whether a data point (or data label) is located at the mouse click,
- extracts the X and Y values for the data point, if the click occurred at a data point or data label,
- displays this information in a message box.
Private Sub Chart_MouseUp(ByVal Button As Long, ByVal Shift As Long, _
        ByVal x As Long, ByVal y As Long)

    Dim ElementID As Long, Arg1 As Long, Arg2 As Long
    Dim myX As Variant, myY As Double

    With ActiveChart
        ' Pass x & y, return ElementID and Args
        .GetChartElement x, y, ElementID, Arg1, Arg2

        ' Did we click over a point or data label?
        If ElementID = xlSeries Or ElementID = xlDataLabel Then
            If Arg2 > 0 Then
                ' Extract x value from array of x values
                myX = WorksheetFunction.Index _
                    (.SeriesCollection(Arg1).XValues, Arg2)
                ' Extract y value from array of y values
                myY = WorksheetFunction.Index _
                    (.SeriesCollection(Arg1).Values, Arg2)

                ' Display message box with point information
                MsgBox "Series " & Arg1 & vbCrLf _
                    & """" & .SeriesCollection(Arg1).Name & """" & vbCrLf _
                    & "Point " & Arg2 & vbCrLf _
                    & "X = " & myX & vbCrLf _
                    & "Y = " & myY
            End If
        End If
    End With
End Sub
Here is an informative dialog that results from clicking on the 4th point of the first series. Compare to the third dialog from the last example above.

This example is demonstrated using the chart named Identify Point in the companion workbook.
You could do many things with the data from this procedure.
- A message box requires a user response to continue; you could replace the dialog by drawing a textbox with the same information, as a smarter chart tip. Use the MouseMove event instead, to mimic Excel’s normal chart tip behavior.
- You could place this data into a worksheet range. After clicking on several points, you would have a small table of values from the selected points. These could be used for subsequent analysis.
- You could identify the clicked point, then jump to another appropriate chart. This approach has the effect of drilling down deeper into the data. See the short example below.
Drill Down to a Related Chart
Suppose the values for the categories A through E in the chart reflected sums of other values. You could have several other chart sheets, Chart A through Chart E, that show detail for the selected categories. An event procedure such as the following produces this kind of drill down effect (to test the procedure, create chart sheets named Chart A, Chart B, etc.):
Private Sub Chart_MouseUp(ByVal Button As Long, ByVal Shift As Long, _
        ByVal x As Long, ByVal y As Long)

    Dim ElementID As Long, Arg1 As Long, Arg2 As Long
    Dim myX As Variant

    With ActiveChart
        ' Pass x & y, return ElementID and Args
        .GetChartElement x, y, ElementID, Arg1, Arg2

        ' Did we click over a point or data label?
        If ElementID = xlSeries Or ElementID = xlDataLabel Then
            If Arg2 > 0 Then
                ' Extract x value from array of x values
                myX = WorksheetFunction.Index _
                    (.SeriesCollection(Arg1).XValues, Arg2)

                ' Don't crash if chart doesn't exist
                On Error Resume Next
                ' Activate the appropriate chart
                ThisWorkbook.Charts("Chart " & myX).Select
                On Error GoTo 0
            End If
        End If
    End With
End Sub
To return to the starting chart on another mouse click, you can add the following Chart_MouseUp event procedure to the code modules of the detail charts. For example, add the following procedure to the code module for the Chart A sheet. When you select an element in Chart A, you’ll return to the main chart:
Private Sub Chart_MouseUp(ByVal Button As Long, ByVal Shift As Long, ByVal x As Long, ByVal y As Long)

    ' Don't crash if chart doesn't exist
    On Error Resume Next
    ' Return to calling chart
    ThisWorkbook.Charts("Chart Drilldown").Select
    On Error GoTo 0

End Sub
This example is demonstrated using the charts named DrillDown and Chart A through Chart E in the companion workbook.
The VBE Project Explorer
You may have noticed the Project Explorer window of the Visual Basic Editor. By default it is docked in the upper left of the VB window. If the Project Explorer window is not open, from within the VBE, choose VBE View menu > Project Explorer or press Ctrl+R. Here is the Project Explorer window in its floating (undocked) state.
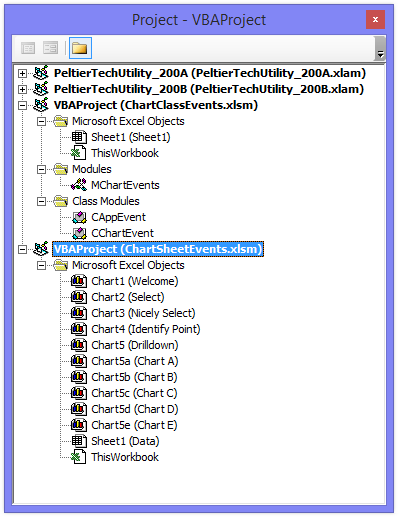
Every VBA Project that you have open in Excel is listed in the Project Explorer, including open workbooks and installed add-ins. If the project is unprotected, its constituent objects are listed in a tree view structure underneath it. If the folder icon in the toolbar is selected, the objects are grouped. If the folder icon is not selected, the objects are listed in alphabetical order without grouping.
You can see three of the four groups of objects in the screenshot above. All chart sheets and worksheets are listed under the Microsoft Excel Objects group, with the ThisWorkbook object that represents the workbook itself. Regular code modules are listed under the Modules group, where we see the module named MChartEvents in the workbook ChartClassEvents.xlsm. The Class Modules group contains class modules, such as CAppEvent and CChartEvent, which will be constructed later in this article. If a project has any user forms, these will be listed under the Forms group.
Under Microsoft Excel Objects, the sheets and workbook are listed in alphabetical order by their “Code Name”. The Code Name is the name of the object in the VB Editor; we see code names Chart1 through Chart5, Chart5a through Chart5e, Sheet1, and ThisWorkbook are shown above. The Excel name of an object is shown in parentheses after its Code Name. You can change the Code Name by changing the (Name) property in the VBE’s Properties window; if you change the Name property, the name displayed on the sheet tab in Excel will be changed.
To access a sheet’s code module, double click it in the Project Explorer window, or right-click a sheet tab in Excel and choose View Code. To access the workbook’s code module, double-click on the ThisWorkbook object in the Project Explorer window.
New Forms, Modules, and Class Modules are added to a project using the VBE’s Insert menu. A new chart sheet or worksheet object is added whenever a sheet is created within Excel. A new project is added to the Project Explorer’s list when a workbook is created or opened, or an add-in is installed, within Excel.
Embedded Chart Events
The approach I have described so far is effective, but only for a single chart sheet. To apply to multiple chart sheets, the event code has to be copied to each chart sheet’s code module. It does not work at all for embedded charts.
A more flexible and powerful technique is to use a class module to trap chart events. A class module can be used for any chart, whether it’s an embedded chart or chart sheet. And it eliminates the need to place the code in a chart sheet’s code module. Any events in the code module of a chart are available in a chart event class module. A chart event class module is demonstrated in the downloadable workbook ChartClassEvents.xlsm.
To create a new class module, click Alt+F11 to switch to the VB Editor. Make sure the ChartClassEvents.xlsm workbook is selected in the Project Explorer window.
Within the VBE, choose Insert menu > Class Module. A new code module opens, with the caption ChartClassEvents.xlsm – Class1 (Code). If the Properties window is not open, choose View menu > Properties, or press the F4 function key. In the Properties window, change the class name to CChartEvent, following the convention that the name of a class module begins with capital C.
The class module should begin with this line:
Option Explicit
If not, follow the instructions in The Chart Code Module subsection in the Chart Sheet Events section of this article, above.
Next, add this line in the Declarations section of the class module, to declare a Chart type object with event trapping enabled.
Public WithEvents EventChart As Chart
After adding this line, the class module contains the EventChart item in the left hand dropdown, in addition to (General) and Class. When the EventChart item is selected, all of the chart events described in the first half of this article appear in the right hand dropdown.
To create the equivalent chart event procedure as you created in the “More Chart Events” subsection above, select EventChart from the left dropdown and Select from the right dropdown, to produce this procedure shell:
Private Sub EventChart_Select(ByVal ElementID As Long, _
        ByVal Arg1 As Long, ByVal Arg2 As Long)

End Sub
The shell of the EventChart_Activate procedure is produced when the EventChart item is selected in the left dropdown. This can be deleted or ignored. Add the Msgbox command within this procedure to identify the element and arguments for the selected chart element. The entire class module code should look like this:
Option Explicit

' Declare object of type "Chart" with events
Public WithEvents EventChart As Chart

Private Sub EventChart_Select(ByVal ElementID As Long, _
        ByVal Arg1 As Long, ByVal Arg2 As Long)

    MsgBox "Element: " & ElementID & vbCrLf & "  Arg 1: " & Arg1 _
        & vbCrLf & "  Arg 2: " & Arg2

End Sub
The code is almost ready to trap chart events, but first you need to enable events for the chart.
Enabling Events for the Chart
Make sure the ChartClassEvents.xls workbook is selected in the Project Explorer window. From the VBE Insert menu, select Module. A new code module opens, with the caption ChartClassEvents.xls – Module1 (Code). In the Properties window, change the module name to MChartEvents, following the convention that the name of a regular module begins with capital M.
The module should begin with this line:
Option Explicit
If not, follow the instructions in “The Chart Code Module” section. Now you must declare an instance of the chart events class, by adding this line in the Declarations section of the class module, immediately below the Option Explicit line.
Dim clsChartEvent As New CChartEvent
Next, you create two procedures, Set_This_Chart and Reset_Chart, To activate a chart for events, you assign the active chart to the EventChart property of the instance of the class:
Set clsChartEvent.EventChart = ActiveChart
To deactivate the chart for events, you assign the EventChart property of the instance of the class to Nothing:
Set clsChartEvent.EventChart = Nothing
These two lines are wrapped in the Set_This_Chart and Reset_Chart procedures, with a check within the Set_This_Chart procedure to prevent errors if no chart is selected. The entire module looks like this:
Option Explicit

Dim clsChartEvent As New CChartEvent

Sub Set_This_Chart()
    ' Skip if no chart is selected to prevent an error
    If Not ActiveChart Is Nothing Then
        ' Enable events for the active chart
        ' Works for chart sheets and embedded charts
        Set clsChartEvent.EventChart = ActiveChart
    End If
End Sub

Sub Reset_Chart()
    ' Disable events for chart previously enabled as active chart
    Set clsChartEvent.EventChart = Nothing
End Sub
To test the procedures, select any chart, embedded or chart sheet, and run Set_This_Chart. Now select any chart element, and a message box pops up to tell you the ElementID, Arg1, and Arg2.
Enabling Events for Chart(s)
This approach is fine for a single embedded chart, but it can be broadened to include all charts embedded in the active sheet. Instead of a variable clsChartEvent, you declare an array clsChartEvents() to contain all of the enabled charts, and wrap them within loops so all embedded charts on the active sheet are included.
Adjust the MChartEvents module to look like this:
Option Explicit

Dim clsChartEvents() As New CChartEvent

Sub Set_All_Charts()
    ' Enable events for all charts embedded on a sheet
    ' Works for embedded charts on a worksheet or chart sheet
    If ActiveSheet.ChartObjects.Count > 0 Then
        ReDim clsChartEvents(1 To ActiveSheet.ChartObjects.Count)
        Dim chtObj As ChartObject
        Dim chtnum As Integer

        chtnum = 1
        For Each chtObj In ActiveSheet.ChartObjects
            ' Debug.Print chtObj.Name, chtObj.Parent.Name
            Set clsChartEvents(chtnum).EventChart = chtObj.Chart
            chtnum = chtnum + 1
        Next ' chtObj
    End If
End Sub

Sub Reset_All_Charts()
    ' Disable events for all charts previously enabled together
    Dim chtnum As Integer
    On Error Resume Next
    Set clsChartEvent.EventChart = Nothing
    For chtnum = 1 To UBound(clsChartEvents)
        Set clsChartEvents(chtnum).EventChart = Nothing
    Next ' chtnum
End Sub
Activate a sheet with embedded charts and run Set_All_Charts. All embedded charts will now respond to chart events as the single embedded chart did in the previous section. This approach works for any embedded charts on a worksheet or a chart sheet (yes, you can embed chart objects on a chart sheet).
The previous code won’t activate the parent chart sheet, however. You reinstate the clsChartEvent declaration, to be used with the chart sheet, and adjust the Set_All_Charts procedure to activate a chart sheet and then activate the embedded charts.
Modify the module to look like this:
Option Explicit

Dim clsChartEvent As New CChartEvent
Dim clsChartEvents() As New CChartEvent

Sub Set_All_Charts()
    ' Enable events for active sheet if sheet is a chart sheet
    If TypeName(ActiveSheet) = "Chart" Then
        Set clsChartEvent.EventChart = ActiveSheet
    End If

    ' Enable events for all charts embedded on a sheet
    ' Works for embedded charts on a worksheet or chart sheet
    If ActiveSheet.ChartObjects.Count > 0 Then
        ReDim clsChartEvents(1 To ActiveSheet.ChartObjects.Count)
        Dim chtObj As ChartObject
        Dim chtnum As Integer

        chtnum = 1
        For Each chtObj In ActiveSheet.ChartObjects
            ' Debug.Print chtObj.Name, chtObj.Parent.Name
            Set clsChartEvents(chtnum).EventChart = chtObj.Chart
            chtnum = chtnum + 1
        Next ' chtObj
    End If
End Sub

Sub Reset_All_Charts()
    ' Disable events for all charts previously enabled together
    Dim chtnum As Integer
    On Error Resume Next
    Set clsChartEvent.EventChart = Nothing
    For chtnum = 1 To UBound(clsChartEvents)
        Set clsChartEvents(chtnum).EventChart = Nothing
    Next ' chtnum
End Sub
Using Event Procedures to Enable Chart Events
Event procedures in Microsoft Excel have different levels of influence. In the earlier example, the event procedures in the code module behind a chart sheet only detect events within the chart sheet. Similarly, event procedures on a worksheet’s code module only detect events in that worksheet. Event procedures on a workbook’s code module trap events that occur in all sheets within the workbook. Finally, application-level event procedures watch over all sheets and workbooks in Excel. There is no application code module, however, so you need to create a special class module to handle application events.
Using these events is a more convenient way to activate chart events than running the Set_All_Charts and Reset_All_Charts procedures used above. The following code examples demonstrate how you can use events to set different levels of activation for chart events:
- all charts in one worksheet
- all charts in one chart sheet
- all charts on all sheets in one workbook
- all charts on all sheets in all workbooks
You can decide which level of activation you need, based on the purpose of your chart event code. If you are only concerned with a single chart in one worksheet, you can stop with the first example. If you have built an extensive add-in that processes events for any charts, you need a full-blown application events class module. The companion workbook ChartClassEvents.xlsm follows level 4.
1. Worksheet Events to Enable All Charts In One Worksheet
You must trap the Activate and Deactivate events for the desired worksheet, and use these events to run the Set_All_Charts and Reset_All_Charts procedures. Right-click the sheet tab, and choose View Code from the pop up menu to open the VBE. You see a new code module with the caption ChartClassEvents.xls – Sheet1 (Code), assuming this is Sheet1. Choose Worksheet on the left hand dropdown and Activate from the right hand dropdown. Now type the line Set_All_Charts inside the Worksheet_Activate procedure stub. Then choose Deactivate from the right hand dropdown, and type the line Reset_All_Charts inside the Worksheet_Deactivate procedure stub. You see the following in the code module:
Option Explicit

Private Sub Worksheet_Activate()
    Set_All_Charts
End Sub

Private Sub Worksheet_Deactivate()
    Reset_All_Charts
End Sub
This code turns on chart events for all charts embedded in the worksheet when it is activated, then turns off chart events when the worksheet is deactivated. If your program executes additional code in the Worksheet_Activate and _Deactivate events, include the lines above with the other code, in the order that works best for your application.
2. Chart Sheet Events to Enable All Charts In One Chart Sheet
You need to trap the Activate and Deactivate events for the desired chart sheet, and use these events to run the Set_All_Charts and Reset_All_Charts procedures. To open the VBE, right-click the sheet tab, and choose View Code from the pop up menu. It opens the code module with the caption ChartClassEvents.xls – Chart1 (Code), assuming this is Chart1. Choose Chart on the left dropdown and Activate from the right dropdown, and type the line Set_All_Charts inside the Chart_Activate procedure shell. Then choose Deactivate from the right dropdown, and type the line Reset_All_Charts inside the Chart_Deactivate procedure shell. You see the following in the code module:
Option Explicit

Private Sub Chart_Activate()
    Set_All_Charts
End Sub

Private Sub Chart_Deactivate()
    Reset_All_Charts
End Sub
This code turns on chart events for the chart sheet itself and for all charts embedded in the chart sheet when the sheet is activated, then turns off chart events when the sheet is deactivated. If your program executes additional code in the Chart_Activate and _Deactivate events, include the lines above with the other code, in the order that works best for your application.
3. Workbook Events to Enable All Charts On All Sheets In One Workbook
Remove the Worksheet_Activate, Worksheet_Deactivate, Chart_Activate, and Chart_Deactivate code that enables chart events for specific worksheets or chart sheets. These procedures are rendered redundant by the following Workbook_SheetActivate and _SheetDeactivate event procedures.
You must trap the Activate and Deactivate events for all sheets (worksheets and chart sheets) in the desired workbook, and use these events to run the Set_All_Charts and Reset_All_Charts procedures. Right-click the small Excel icon to the left of the File menu, and choose View Code from the pop up menu to open the VBE. It opens the code module with the caption ChartEvents.xls – ThisWorkbook (Code). Choose Workbook on the left dropdown, SheetActivate from the right dropdown, and type the line Set_All_Charts inside the Workbook_SheetActivate procedure stub. Then choose SheetDeactivate from the right dropdown, and type the line Reset_All_Charts inside the Workbook_SheetDeactivate procedure stub. You now see the following in the code module:
Option Explicit

Private Sub Workbook_SheetActivate(ByVal Sh As Object)
    Set_All_Charts
End Sub

Private Sub Workbook_SheetDeactivate(ByVal Sh As Object)
    Reset_All_Charts
End Sub
This code turns on chart events for all charts embedded in the newly activated sheet, and for the sheet itself if it’s a chart sheet, then turns off chart events when the sheet is deactivated. If your program executes additional code in the Workbook_SheetActivate and _SheetDeactivate events, include the lines above with the other code, in the order that works best for your application.
4. Application Events to Enable All Charts on All Sheets In All Workbooks
You must trap the Activate and Deactivate events for all sheets (worksheets and chart sheets) in any workbook, and the Activate and Deactivate events for all workbooks, and use these events to run the Set_All_Charts and Reset_All_Charts procedures. This process is a little more involved than using sheet or workbook events because you must create a class module to detect application events.
To create the Application Event Class Module, switch to the VB Editor to create a new class module. Make sure the ChartClassEvents.xls workbook is selected in the Project Explorer window. In the VBE, choose Insert menu > Class Module. A new code module opens with the caption ChartClassEvents.xls – Class1 (Code). If the Properties window is not open, choose View menu > Properties or press the F4 function key. In the Properties window, change the class name to CAppEvent (following the convention that the name of a class module begins with a capital C). Now declare an Application type object with event trapping enabled, by adding this line in the Declarations section of the class module.
Public WithEvents EventApp As Excel.Application
After adding this line, the class module contains the EventApp item in the left dropdown, in addition to (General) and Class. Select EventApp from the left dropdown, and select in turn SheetActivate, SheetDeactivate, WorkbookActivate, and WorkbookDeactivate from the right dropdown. Insert the line Set_All_Charts in the Activate event procedures, and Reset_All_Charts in the Deactivate event procedures. The CAppEvent class module should now contain this code:
Option Explicit

Public WithEvents EventApp As Excel.Application

Private Sub EventApp_SheetActivate(ByVal Sh As Object)
    Set_All_Charts
End Sub

Private Sub EventApp_SheetDeactivate(ByVal Sh As Object)
    Reset_All_Charts
End Sub

Private Sub EventApp_WorkbookActivate(ByVal Wb As Workbook)
    Set_All_Charts
End Sub

Private Sub EventApp_WorkbookDeactivate(ByVal Wb As Workbook)
    Reset_All_Charts
End Sub
You must create an instance of the application class before it will respond to events. To activate the application event class, in the MChartEvents module, add a declaration line:
Dim clsAppEvent As New CAppEvent
Insert the following procedures into the MChartEvents module. The first tells the class that it is responding to events in the current application, and enables events in the active sheet’s charts. The second tells the class that it is responding to events in Nothing (no events!), and disables events in the active sheet’s charts.
Sub InitializeAppEvents()
  Set clsAppEvent.EventApp = Application
  Set_All_Charts
End Sub

Sub TerminateAppEvents()
  Set clsAppEvent.EventApp = Nothing
  Reset_All_Charts
End Sub
The last step in activating application-level events is to run the InitializeAppEvents procedure. You could use a command bar button or menu command for this, but those approaches both require the user to remember to go click something. Since you now are an expert on events, you can use workbook events to activate the application events.
The application events and chart events class modules likely reside within an add-in or workbook you’ve built to trap events from the entire application. Open the ThisWorkbook code module for your workbook. If your program is a regular workbook, use the dropdowns at the top of the code module to insert Workbook_Open and Workbook_BeforeClose procedures, and enter InitializeAppEvents and TerminateAppEvents where appropriate, as shown below:
Private Sub Workbook_Open()
    InitializeAppEvents
End Sub

Private Sub Workbook_BeforeClose(Cancel As Boolean)
    TerminateAppEvents
End Sub
If your program is an add-in, use the dropdowns at the top of the code module to insert Workbook_AddinInstall and Workbook_AddinUninstall procedures, and enter InitializeAppEvents and TerminateAppEvents where appropriate, as shown below:
Private Sub Workbook_AddinInstall()
    InitializeAppEvents
End Sub

Private Sub Workbook_AddinUninstall()
    TerminateAppEvents
End Sub
When the workbook is opened or the add-in installed, the application event class is instantiated, so it can begin watching for chart events. When the workbook is closed or the add-in uninstalled, the application event class in terminated, and chart events are no longer trapped.
In a perfect world, this would be sufficient to keep the application event procedures working. In our programming environment, however, many things can break the application event hooks. If your program encounters a run time error, for example, you may find yourself without application events, and therefore, without chart events. You should insert the InitializeAppEvents line into other procedures where appropriate. For example, you could place it at the top or bottom of every procedure run from your program’s command bar and menu buttons.
The Final Event
In this article, you found out how useful chart events can be. They can extend the user interface of the programs you write, making it easy for users to identify points for your program to work on. With a little ingenuity, you can create powerful applications. For example, recently, I made a utility that draws a trend line for only part of a plotted series using the first and last points indicated by two mouse clicks. I made another utility that lets the user zoom in and out on the basis of mouse actions. Once you’ve experimented with chart events, you’ll think of many ways to enhance your projects.
Chart Event Articles on the Peltier Tech Blog
There are several examples that make use of chart events on this blog, including:
Chart Event to Highlight a Series
Chart Event Class Module to Highlight a Series


Derk says
Thanks, Jon, for taking the time to put together this very clear, useful tutorial.
Peter Bartholomew says
Jon. Great article! It would have saved me weeks of trial and error in the past, searching help pages for ideas at a time when my VBA skills were really not up to the job. I came at the problem from another direction; I wanted to animate shapes, known by some as ‘chart-junk’, and eventually found that this could be done by embedding the shapes within ChartObjects or on Chartsheets.
In passing I found many uses of the MouseMove event including highlighting data points as the mouse tracks over them, both on the active chart and on associated choropleth maps or drilldown charts, as well as rotating objects in 3D.
!274&authkey=!AAiGrXEodBGG-rE&v=3&ithint=photo%2cPNG
Neale Blackwood says
Comprehensive article – thank you very much for all your effort. Will save much googling. The Chart Object model takes quite a while to get to get your head around and to use correctly.
Walter says
Thanks Jon. Is it possible that when the section is selected a range is activated on another sheet?
Walter
Richard says
Hi Jon
your lines are vey helpful. But I found out that your solution in point 4 not work if I use this reference
‘VBIDE {0002E157-0000-0000-C000-000000000046} 5 3. Please could you give me an advice that it work with this reference too.
Thanks
Richard
Jon Peltier says
Richard –
What is this reference?
Richard says
Dear Jon
I have answered your mail with a screenshot and a small test case. I hope you can can reproduce this behaviour easily
Best regards
Richard
Tom Rose says
Jon,
Thanks for all the useful information from your site. I knew nothing about embedded charts and was able to build something that worked. The only thing I’m still having trouble with are moving data labels on a XYscatter chart. I have been looking but have not found a solution. If you know of any please feel free to share and again thanks for the sight!!
Tom
Jon Peltier says
Tom –
How do you need to move the labels?
Jordan says
Incredibly in-depth article! I am definitely coming back to this page as reference later. Thank you!
Joseph Hobbs says
Now this might be a silly question but is there a way of preventing the chart area selecting when working with events?
Vince West says
Great article, thanks very much. I have implemented some code using these ideas and I notice 2 things:
1) When I left click with shift, alt, shift+alt or nothing pressed, I get the correct values for button (i.e. 1, 4, 5, 0). However, when I ctrl + left click, the event doesn’t actually fire. Why is that?
2) When I right click, the mouse_up event also does not fire meaning I cannot attach any actions to shift + rightclick for example. Is this a limitation? Thanks.
Jon Peltier says
Joseph –
The chart has to be activated to respond to chart events, which means the chart area will be highlighted.
Doug Glancy says
Great post Jon. I’ve seen it before but had forgotten about it.
The download link for the WithEvents demo is wonky. I get a bunch of Webdings in Firefox and IE.
Jon Peltier says
Doug –
I just used Chrome to download that file to my computer, then used Excel 2016 to opend the downloaded file. It opened fine, and the procedures worked fine, no wingdings or funny characters. You’re not trying to open it directly from the web, are you?
Doug Glancy says
Jon, as soon as I click the link I get a screen full of symbols. It does work for me in Chrome as well.
On another note I see that we both modified WordPress’s “Leave a Comment” default to “Speak Your Mind.”
Jon Peltier says
Doug –
Is the gibberish in the browser itself? Some things should be read in the appropriate applications, no matter how brilliant <cough cough> the browsers have become.
Doug Glancy says
Jon, yes in the browser itself. Again, I click the link and up pops a page of gibberish. There is no choice to save or view. There is no choice at all.
Just:
1. Click link
2. See gibberish
Have you tried it in IE of Firefox? I can try from home in a couple hours and see if I get the same results.
Jon Peltier says
Doug –
I have not used Firefox in years. I don’t know if it’s even installed on any of my working machines. I may have IE buried somewhere, but on the computer I’m using now I only have Edge. Edge just downloaded the file, no attempt to read it.
I noticed for both Chrome and Edge, and I seem to remember for IE and Firefox, that if you right-click on the link, there is an option to save as, and either a dialog pops up or the save goes straight to the downloads folder.
Doug Glancy says
Jon, You’re right about the right-click option in Firefox. At home I get the same behavior as at work with Firefox, and of course have Edge like you. IE still comes with Windows 10 for compatibility – you can find it with a search. I zip all my downloads, and I think that’s pretty common, so maybe that’s why this behavior seemed different than usual: With a zip file you start out in Windows Explorer no matter what, which, as you alluded above, is best.
Anyways, amazing post. I just went ahead and figured out the WithEvents code – I use a Collection instead of an array and it always takes a minute to get the bits all working. But it’s really cool once it is. I’ve also been working with some chart context menu xml and some code to navigate back and forth between pivot charts and pivot tables. Fun stuff!
Jon Peltier says
Doug –
Sounds like a cool project.
Doug Glancy says
I’m back a couple of months later to let you know I finished my post on the Pivot Table and Chart Navigator. It lets users navigate between pivot charts and tables using a form and modified context menus. It’s at http://yoursumbuddy.com/pivot-table-pivot-chart-navigator/. I’d love to know what you think. Part of the navigator is a workbook-wide chart selection event based on the concepts in this post, and which I cover my post previous to the one linked above. Thanks again!
Bryan Podor says
I want to use chart events on an embedded chart – I’ve used your method from stackoverflow to fire events on embedded charts but I’m now running into a wall with the chart needing to be activated. I really need to keep the chart locked against edits and I don’t see any way to allow the chart to be activated without allowing edits. The only event I want access to is MouseMove (I’m replacing tooltips). Any suggestions? Thanks
Ryan says
Jon, is there a limitation the how large the series data set can be. I’m using your “Identify the Point Clicked By the User” example. I click on a point at the strat of a series and all returns fine, however about middle ways through the series the code stops working and gives a “unable to get the Index property of the worksheetfunction class” debug error. Please advise.
Jon Peltier says
Ryan –
There shouldn’t be a problem for larger series. I just built an example with 500 points, and it worked as expected. How large is your series? Are there any blank cells in the data range (which shouldn’t matter)?
Put a breakpoint at this line:
When the code stops here, mouse over Arg1 and Arg2 in the .GetChartElement line, and see what their values are.
Sergio says
Good morning everyone.
I would like to have answers/advices on the following issues.
I wolud like to insert (embed) a xy scatter-plot into a form created with VB for Excel (much like in the way VB with PictureBox).
Is that posible? Can it be done?
Thanks in anticipation.
Jon Peltier says
Sergio –
This can be done. I have a draft article underway, don’t know when it will be published.;
Stephen Jackson says
SO INCREDIBLY more useful than Microsoft’s How To’s, etc Thank you!
Kim says
I’m having trouble running the code on the attached example file, it appears that when changing tabs something sets the Application.EnableEvents to False. HOWEVER, this does not actually trigger the “watch” on Application.EnableEvents.
As best as I can tell: things are working, Application.EnableEvents is set to True, popups are correctly occurring when I’m clicking on my graphs. Then I change the tab. When the tab changes, no events fire on the newly selected tab. Entering Application.EnableEvents=True in the Immediate window fixes this until I select a different tab again. Even going back to my previous tab, I need to re-enable Events. At no point here, does my Watch on Application.EnableEvents show it being set to False.
When I hit enter in the Immediate window after typing nothing, then and only then does the watch show Application.EnableEvents being set to False.
Why is this happening, how can I get it to KEEP events enabled when changing tabs? I suppose I could try an event on tab-switching to enable events again, but I’d rather not make a workaround for an error…
Using Excel 2010.
Jon Peltier says
Hi Kim –
Could you post your coffee? Or upload your file to a file-sharing site (e.g., Dropbox)?
Sarvesh D. says
This blog is simply amazing on how to use charts …….. I searched a lot and lost all hopes to use charts as object. After reading this detailed script i was able to write complex chart VBA.
You are great …. Jon Peltier !!!
Tom Marshall says
I have been programming in VBA (amongst other languages) since 1992 ish. This is brilliant! Thank you.
Miky says
hi, how do I get the values of the category and a point when I selected one point?
Example I select a point in a chart lets say a bars graph and the selected point is maybe 5 and references category Products.
And I want a msgbox with the values “Products” and “5”.
Thanks
Jon Peltier says
Miky –
In the section of this article titled “Identify the Point Clicked By the User”, the procedure Private Sub Chart_MouseUp detects the click, determines that a particular point was clicked on, then it finds the corresponding X value (category) and Y value.
Arif says
Hi Peltier,
Thank you for your great article about chart event. I have used your provided downloadable workbook with little modification as need. It worked fine for me with little inconvenience. When I click on an chart data label it shows a message as intended. But after that, data label box is being attached with the cursor point and moving with the cursor point. So data label being displaced and painful to clicking on next data label ,
Can you please explain why this happening and how to fix it.
Thank you.
Jon Peltier says
Hi Arif –
This is an annoying problem with the Chart_Select event. It happens with data labels, the plot area, the legend, and any other element you can drag around. The code fires before Excel registers the Mouse Up, so the element you’ve selected is still actively under control of the mouse. You can use the Chart_MouseUp event instead.
Here is how I would use MouseUp instead to Select (in the ‘Select’ chart sheet):
If you still have to use the Chart_Select event, for whatever reason, you could insert this line before
End Sub:It will unselect whatever element you clicked on, though that means you cant then do anything with that element.
Arif says
Hi Peltier,
Thank you for your quick reply.
Unfortunately selecting the chart area method didn’t work and saying “Method or data member not found”. But it helped me to get the unselecting idea and accomplished my need.
Thank you so much.
Zakir Hussain Datey says
How can I have a mouseover event when the mouse is hovering over the pie chart slice, the slice show shadow and color change in Excel 2016. Please advice
Jon Peltier says
You would put a MouseMove event procedure in the class module or chart sheet module:
The event procedure calls the following sub to apply highlighting to the point which was hovered over:
My code applies a simple fill color to the highlighted point. You can apply whatever formatting you like.
Zajir says
Thanks for your reply. Will implement and update.
Zakir Hussain Datey says
Executed the code but MS Excel Chart is not giving the desired result. It’s trying to register the code as Macro but still, the result is not as required.
Any instructions.
Best regards,
Jon Peltier says
I set up my workbook following the protocols under ‘Embedded Chart Events’ in this article. The code I posted is included in the
CChartEventclass module.If you’re using a chart sheet, the name of the first procedure would change from
EventChart_MouseMovetoChart_MouseMove, and the code should be included in the code module behind the chart sheet.K C says
I often have multiple series that are graphed in very close proximity to each another on a line chart. Is there a way to click on an x, y location on the chart and use VBA to return the value of a specified series, ignoring the others? When I do it outside of VBA, I often get the value of a series I’m not interested in.
Assaf Levi says
Hi Jon,
First of all, thanks for the incredibly useful tutorial.
I would like to take an action directly when clicking a specific point within a chart series. Due to the way Excel charts work, the first click selects the entire series (i.e.: Arg2 is -1), and only upon the second click, the point is selected. Is there a way to get Excel to skip the entire series selection and directly select the point?
Jon Peltier says
Hi Assaf –
When you use the MouseDown or MouseUp events, you can identify which point was clicked on, ignoring the issue of what is usually selected in the absence of chart event code.
To select one point on the first click, you can use this modification to the MouseUp procedure:
In general, when writing procedures to perform actions on Excel objects, it is not necessary to select those objects first. If this were my case, I would not the series and point, select the chart area, then do what I wanted with the point.
Gurpreet Singh Kainth says
This is awesome! Salute to your skills.
Knowledge is the most impactful gift that a person can give to someone!
I hope you are doing well and are enjoying life!
Best wishes to you in whatever endeavor you embark on.
Marcos says
Hi Jon,
This is extremely helpful. However, I’m having issues when using the chart_activate event with embedded charts. The same issue happens in your ChartClassEvents.xlsm workbook. When clicking on a chart, the Message box appears as expected, but after closing it the chart/element is in “move mode” (without doing anything), like I had clicked and dragged it. If it’s the plot area or any other element of the chart that’s moveable, it shows the blue dotted lines to reposition it, and if it’s the chart itself it moves with the cursor until I click again to fix it in that new position or cancel pressing the Esc key.
It also seems odd that after the repositioning I can Undo it (I thought anything done via macros reset the Undo stack, so maybe this is caused by something else in the application after the macro?)
I’m wondering if if you can replicate the same issue, and if there’s a fix to it.
Many thanks,
Marcos
Jon Peltier says
Yes, I’ve seen this happen, and I think this is why.
Sometimes when a MouseDown event is running, it doesn’t detect the corresponding MouseUp action. The element you clicked on is still selected and active, and Excel still thinks the mouse is down and you are dragging the element when you move the mouse. You can undo the action because it is an action you are taking (inadvertently) after the code has run.
Using the MouseUp rather than the MouseDown event in your case will probably avoid the inadventent moving of chart elements.
Marcos says
Hi Jon,
Apologies, I later realized you had already mentioned that in a previous comment. Thanks for responding. I tried MouseUp but it seemed to be only working when clicking on an element of the chart other than the chart area, and I was looking for something to work when clicking anywhere on the chart.
I was able to use _activate successfully with other code that didn’t have a MsgBox.
Out of curiosity, is there a way the _activate could work with the MsgBox?
I tried your suggestion of Me.ChartArea.Select but that is throwing an error “Method or data member not found”, and I also tried using ActiveChart.Activate and other combinations but they also throw and error.
Many thanks for such a comprehensive tutorial, I wouldn’t have been able to achieve what I wanted to do without it. Best,
Jon Peltier says
This reacts to a click anywhere. The MouseDown captures the ChartArea click and ignores all others, while the MouseUp captures the rest. I use
Me.GetChartElementbecause I spun this up quickly in a chart sheet.Me.ChartArea.Selectwill not work in the class module, only in the code module of a chart sheet. You need to use the variable you used in the class for the event-enabled chart:EventChart.ChartArea.Select.Angus Rouse says
Excellent post, really well explained and easy to follow.
However, I’m seeing a strange behaviour for embedded chart(s) where the x and y values from EventChart_MouseUp appear to be the correct coordinates of my cursor position within the chart however the Element returned from ActiveChart.GetChartElement x, y, ElementID, Arg1, Arg2 is incorrect and actually represents an element offset to the right and below my actual cursor position. e.g. cursor position is x:100, y: 50 but the element returned is on the basis of coordinates x:110 and Y:55
This offset gets progressively larger as I move the cursor further right and downwards within the chart area.
Strangely this only happens sometimes – even for the same workbook and chart. Anyone experienced this?