In Using Pivot Table Data for a Chart with a Dual Category Axis, I showed how to make a Chart with a Dual Category Axis using a pivot table to properly arrange the source data. I generally prefer using a regular chart, because pivot charts are pretty inflexible when it comes to formatting. Unfortunately, a regular chart doesn’t know when the pivot table has been resized by a refresh. If you know that the pivot table will only grow in one direction, that is, the number of series remains the same but the number of points in a series may change, you can define dynamic ranges that stretch with the pivot table.
The data initially looks like this:

and the pivot table like this, with the top left corner of the pivot table in cell F2:

Let’s define the names according to this table:
| Name | Refers To |
| ‘PT Names’!PTDefectCount | =COUNT(‘PT Names’!$D:$D) |
| ‘PT Names’!PTData | =OFFSET(‘PT Names’!$A$1,0,0,1+’PT Names’!PTDefectCount,4) |
| ‘PT Names’!PTCatList | =’PT Names’!$F$3 |
| ‘PT Names’!PTCat1 | =’PT Names’!$H$3 |
| ‘PT Names’!PTCat2 | =’PT Names’!$I$3 |
| ‘PT Names’!PTCat3 | =’PT Names’!$J$3 |
| ‘PT Names’!PTCategories | =OFFSET(‘PT Names’!PTCatList,1,0,’PT Names’!PTDefectCount,2) |
| ‘PT Names’!PTValues1 | =OFFSET(‘PT Names’!PTCat1,1,0,’PT Names’!PTDefectCount,1) |
| ‘PT Names’!PTValues2 | =OFFSET(‘PT Names’!PTCat2,1,0,’PT Names’!PTDefectCount,1) |
| ‘PT Names’!PTValues3 | =OFFSET(‘PT Names’!PTCat3,1,0,’PT Names’!PTDefectCount,1) |
Note that all names are defined locally for the worksheet containing the data and pivot table. PTDefectCount is the number of rows of data in the original table and in the pivot table. PTData is the data range used as the pivot table’s source. PTCatList is an anchor for the PTCategories name, which in turn encompasses the two columns of main and sub categories, the category labels for the chart. PTCat1 through 3 are the names of the three series in the chart, and the anchors for PTValues 1 through 3, the Y value ranges for the three series.
The chart is constructed like that in Using Pivot Table Data for a Chart with a Dual Category Axis. The three series formulas are:
=SERIES(‘PT Names’!PTCat1,’PT Names’!PTCategories,’PT Names’!PTValues1,1)
=SERIES(‘PT Names’!PTCat2,’PT Names’!PTCategories,’PT Names’!PTValues2,2)
=SERIES(‘PT Names’!PTCat3,’PT Names’!PTCategories,’PT Names’!PTValues3,3)

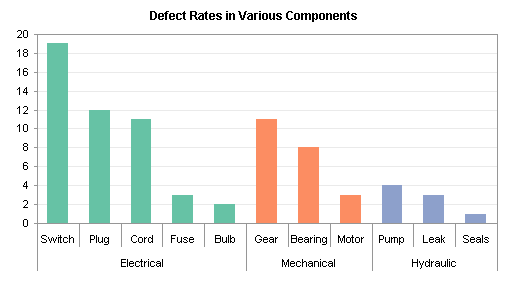
This looks like the previous chart, but it’s now dynamic, ready to change as the data table and its pivot table are updated. Add some rows to the pivot table source data range:

The name PTData expands to include the added rows. Refresh the pivot table:

The chart data ranges also expand, and the chart reflects the added data:

The Mechanical category has moved to the left of Electrical, because its total is now highest. The Category field in the column area of the pivot table has been changed so it is not sorted by defect count. Therefore the series are plotted in the same order (electrical is first), and the colors of the series do not change.
This technique works because I know that the number of columns in the pivot table will not change, only the number of rows. If there is a chance that the number of main categories will change, then this technique will not work, because a dynamic name can only be used to define the X or Y values of a chart series, or its name. A dynamic name cannot be used to specify the number of series in the chart.
Note: In a chart that is not based on a pivot table, a dynamic name can be defined that grows in height and width, and such a name can be used for the chart’s entire source data range (X values, Y values for all series, and all series names). There are two shortcomings with this approach. When you use a name to define the source data range, excel replaces the name by its cell address, and you lose the benefit of having defined a dynamic name. Also, if you define the source data for a chart, and the range includes a pivot table, then the pivot table becomes the data source, and the chart becomes a pivot chart.
Third in a series
- Chart with a Dual Category Axis
- Using Pivot Table Data for a Chart with a Dual Category Axis
- Dynamic Chart using Pivot Table and Range Names
- Dynamic Chart using Pivot Table and VBA


