How Many Squares
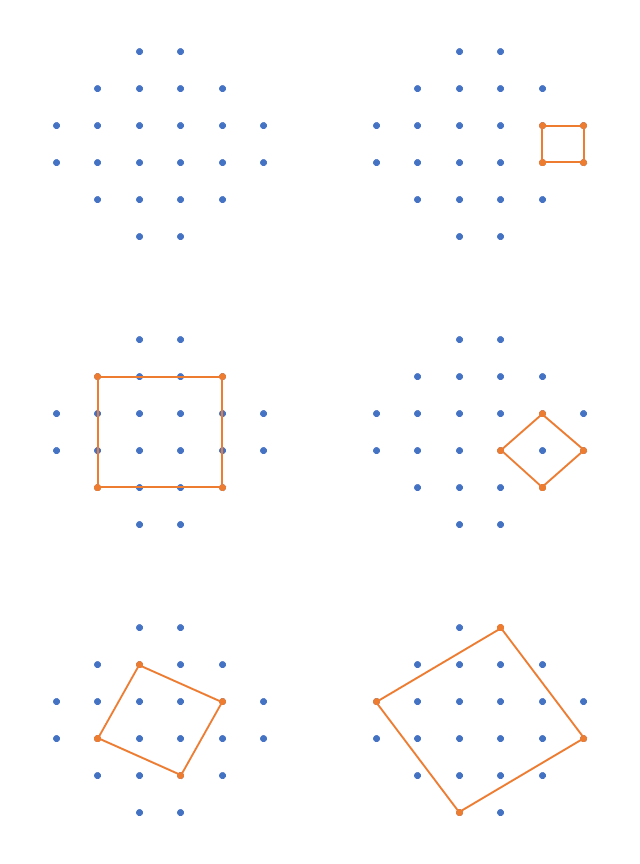
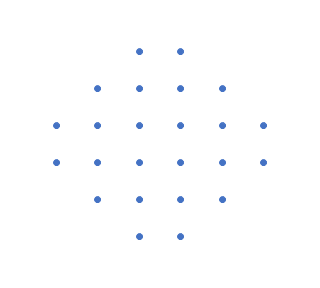
In my recent article How Many Squares? (1. Interactive Chart), I answered a question posed by my friend and colleague Carlos Barboza on LinkedIn: How Many Squares? Given the partial grid of dots shown, how many squares can you form using these dots as the vertices of the squares?
I made my own workbook, so I could easily keep track of squares. Then I set up a way to select and draw any of those squares. This interactive chart is described in How Many Squares? (1. Interactive Chart).
Then I thought it would be great to automate the process, using VBA to cycle through each of the squares in turn. You can download my workbook from the link below (actually it’s a zip file containing the workbook). The workbook contains a simple VBA procedure, which I’ll describe, so you will need to unblock the workbook in Windows to allow macros, then enable macros when you open the file.
Check out my recent article Unblocking and Enabling Macros if you need help unblocking this workbook.
Automate Display of the Squares (VBA)
I put together a simple VBA procedure that will highlight each of the squares in turn, by changing the value of ScrollNow in cell T2. Remember that cell T3 is called ScrollMin and contains zero, and cell T4 is called ScrollMax and contains 46. We need one more Name which I will call Pause, to designate the pause in seconds between changing from one square to the next.
I selected cell L8, entered a value of 0.25, and named it “Pause”. I initially used a value of 1, but that cycled through the squares too slowly.
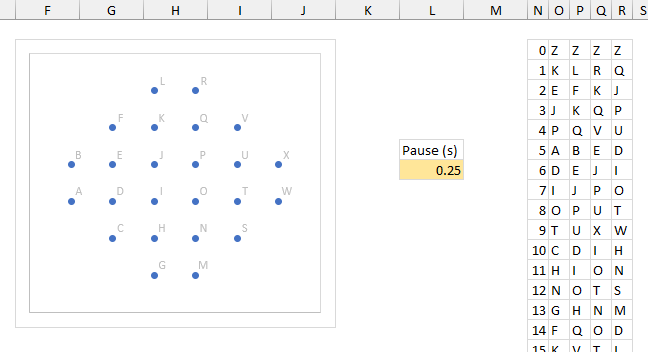
I also named the worksheet wsDotsAndSquares in the VBA Editor’s Project Explorer.
ScrollMin, ScrollMax, ScrollNow, and Pause will be inputs into the VBA procedure. Here is the procedure:
Sub CycleThroughTheSquares()
  Dim iMin As Long, iMax As Long
  iMin = wsDotsAndSquares.Range("ScrollMin").Value2
  iMax = wsDotsAndSquares.Range("ScrollMax").Value2
  Dim tPause As Double
  tPause = wsDotsAndSquares.Range("Pause").Value2
  Dim rNow As Range
  Set rNow = wsDotsAndSquares.Range("ScrollNow")

  Dim iNow As Long
  For iNow = iMin To iMax
    rNow.Value2 = iNow
    Dim t As Double
    t = Timer
    wsDotsAndSquares.Calculate
    DoEvents
    Do
      DoEvents
      If Timer - t > tPause Then Exit Do
    Loop
  Next
  rNow.Value2 = 0
End Sub
iMin and iMax take the values of ScrollMin and ScrollMax; tPause takes the value of the cell Pause. rMin is a reference to the cell ScrollNow, not its value. The code loops from iMin to iMax, assigning the value iNow to the cell ScrollNow, which updates all of the formulas and thus the chart. Timer is a function that returns the value from the computer’s clock, in seconds, with a resolution better than a hundredth of a second. We check the time at the beginning of the loop, then keep checking within a nested loop until the new Timer value is greater than the initial value plus tPause.
Then I added a Form Menu button. Go to Developer > Insert > Form Menu Button. Draw the button in the worksheet, then when the Assign macro dialog pops up, select the macro above and click OK.
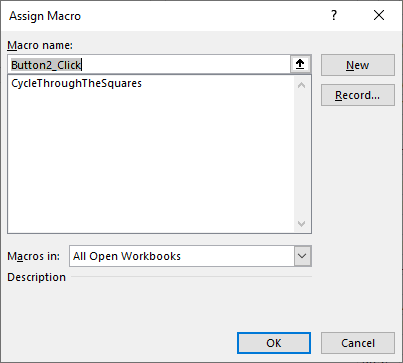
Give your button a more descriptive caption (“Show Squares”) and resize and reposition it as desired. I put mine above the Pause cell near the chart.
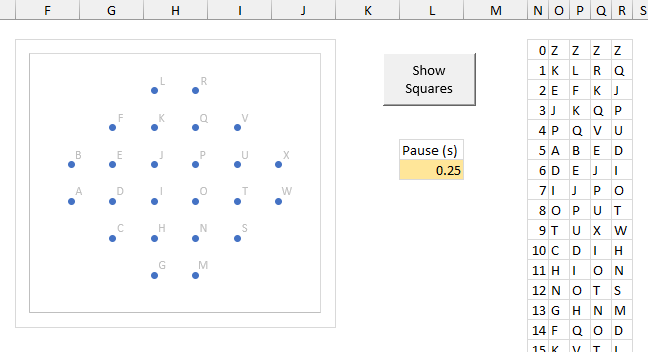
Click the button, and the square number will increment from zero (no square) through 46, finally returning to zero, spending about 0.25 seconds (Pause) at each square.
Display Squares in Random Order (VBA)
I wrote another VBA procedure that will show the charts in random order. It’s much like the first procedure, but I make use of some new Dynamic Array functions. I use SEQUENCE to generate a list of numbers from 1 to iMax. I use RANDARRAY to generate a list of random numbers corresponding to this sequence. Then I use SORTBY to sort the sequence according to the random numbers. The squares are displayed in the order that the square numbers appear in the randomly sorted sequence.
Sub CycleThroughTheSquaresInRandomOrder()
  Dim iMax As Long
  iMax = wsDotsAndSquares.Range("ScrollMax").Value2
  Dim tPause As Double
  tPause = wsDotsAndSquares.Range("Pause").Value2
  Dim rNow As Range
  Set rNow = wsDotsAndSquares.Range("ScrollNow")
  rNow.Value2 = 0

  Dim v As Variant, w As Variant, x As Variant
  v = WorksheetFunction.Sequence(iMax)
  w = WorksheetFunction.RandArray(iMax, , 0, 1, False)
  x = WorksheetFunction.SortBy(v, w, 1)

  Dim iNow As Long
  For iNow = 1 To iMax
    rNow.Value2 = x(iNow, 1)
    Dim t As Double
    t = Timer
    wsDotsAndSquares.Calculate
    DoEvents
    Do
      DoEvents
      If Timer - t > tPause Then Exit Do
    Loop
  Next
  rNow.Value2 = 0
End Sub
You can assign this macro to the original Show Squares button, or add a new button.
Make an Animated GIF
How can I talk about animated charts without showing an animated image? How Many Squares? (3. Animated GIF) shows how easy it is to create an animated GIF that cycles through all of our squares.


