Today’s post is written by David Montgomery, who has a new blog called David @ Work. David read two of my recent posts, Fill Below an XY Chart Series (XY-Area Combo Chart) and Fill Between XY Chart Series (XY-Area Combo Chart), and noted the lack of an explanation for different colors between XY series that cross. These articles no longer exist, but have been replaced by Fill Under or Between Series in an Excel XY Chart.
David attacked the problem in his blog post Two Color XY -Area Combo Chart, and he has graciously accepted my offer to repost his article below.
Two Color XY-Area Combo Chart
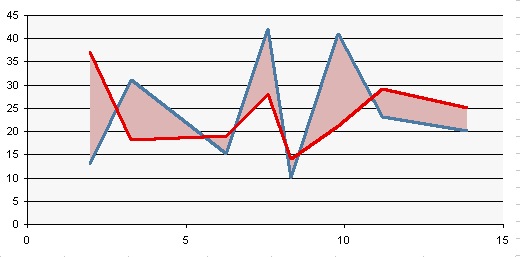
Last Wednesday, Jon explained the technique for creating an XY-area combo chart. The original article shows how to color the area between two lines in a chart where the lines never cross. I’m going to assume you read the article and that we’re all starting at this point:

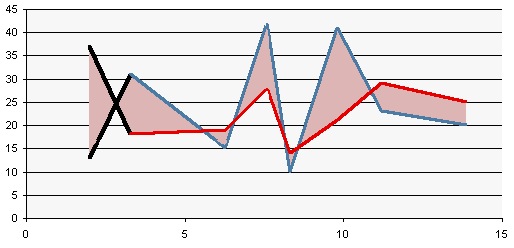
But what if you want to cross the lines? The good news is that this isn’t Ghostbusters and crossing the lines doesn’t break anything, the area between the lines is still filled in perfectly. If we flip the values in B5:C5, B7:C7, and B9:C9, we get the following:
The bad news is that the fill series is only one color and as soon as you show it to your boss she’ll ask why the positive and negative areas aren’t green and red, respectively (which you shouldn’t do anyway because a lot of people are red/green colorblind). Before today, you would have said that it would take too long to add a second color, that it was impossible, or you would have just drawn auto shapes on top of the chart. Today though there is a much easier solution:
- Download the workbook at the end of this post.
- Plug in your data values.
- Profit.
But if you’re like me, and I know I am, chances are you’re reading this blog because you want to learn how to do it yourself. At this time I should note that Excel 2003 and I have a monogamous relationship and that some of these steps may be different for other versions of Excel.
Okay, so the first thing that is obvious is that you’ll need to add another data series if you want an additional color. Creating separate positive and negative data series doesn’t work by itself though; you need your positive and negative shading to end where the lines intersect, but the shading will continue on to the next point on the x-axis with the current configuration.

What we need to do is find the x values at the points where the lines intersect and add them to our secondary x-axis (just a recap, the lines are on the primary x-axis, the shading on the secondary x-axis).
This isn’t as hard as it sounds, but when searching for a way to find the point where lines intersect in Excel I found a lot of people suggesting Goalseek. This deeply offends the math geek in me. Letting machines do math for you is only okay if you told it exactly what to do. If you didn’t tell it what to do, the computer is thinking for you, and that is a slippery slope to Skynet. But I digress…
The common formula for a straight line is y = mx + b, where m is the slope and b is the y-axis intercept. At each point of intersection in our chart, we have two lines:
y1 = m1x1 + b1
y2 = m2x2 + b2
Because we want the point where the lines intersect, y1 = y2 and x1 = x2. Also, because both of the formulas equal y, they are also equal to each other and we can simplify to:
m1x + b1 = m2x + b2
Solving for x gives us:
x = (b2-b1)/(m1-m2)
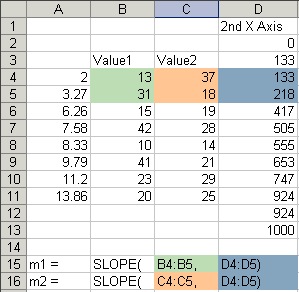
Slope m1 and intercept b1 correspond with the top line, the red one in the example, and m2 and b2 refer to the bottom/blue line. For now, let’s focus on the first point of intersection where the two bolded line segments cross:
Excel has built in functions for calculating the slope and the intercept for a range of x and y values which they’ve cleverly named SLOPE() and INTERCEPT(). We’ll only need two points to calculate each of our line segments, so our formulas to calculate the two slopes (m1 & m2) between the first and second points will look like this:
Our two y-axis intercepts are calculated in the exact same way, just replace SLOPE with INTERCEPT. We’ll need to calculate the slope and intercept for both line segments at every point where the lines cross. If the lines don’t cross, we can skip the calculation.
Because the lines can potentially cross between any two data points, we’re doubling the size of the original secondary x-axis. Every other point will be one of the original data points, and the in-between points, which are the potential points of intersection, will either be NA() if the lines don’t cross (Excel will skip over #N/A errors when plotting most types of charts) or something like this formula (for cell G5) if they do cross:
=(INTERCEPT(C4:C5,D4:D5)-INTERCEPT(B4:B5,D4:D5)) /
(SLOPE(B4:B5,D4:D5)-SLOPE(C4:C5,D4:D5))
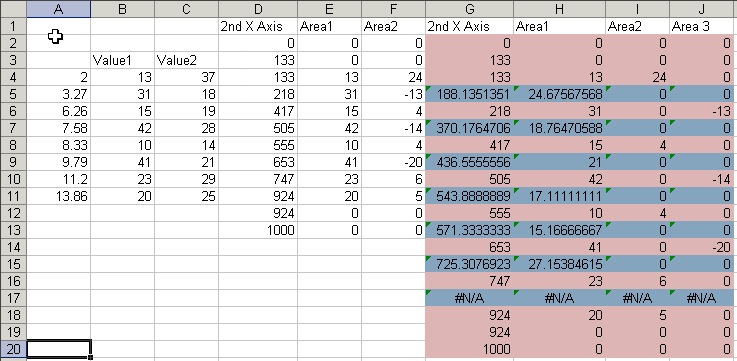
Remember that we’re just replacing the m and b values in x = (b2-b1)/(m1-m2) with the SLOPE() and INTERCEPT() functions. It isn’t as bad as it looks. In this image I’ve added the new secondary x-axis points in column G; the red shaded cells are the original points, and the blue points are the potential points of intersection that we’ve calculated:

Of course the formulas in the workbook are much uglier because I’m counting ROWS() and using the OFFSET() formula so I don’t have to manually add each line segment from the original data set, but it’s a little hard(er) to follow. Another trick to avoid manually entering each formula would be to insert blank cells between your original points in D4:F11. That way the original secondary x-axis and the new one in column G will be the same size and your formulas should copy down correctly.
So to recap, our new secondary x-axis should look something like column G. You still run from 0 to 1000, you still repeat the first and last value, and every other point is one of the original points as calculated in Jon’s original post. The points in between are #N/A errors if the lines don’t cross and the x values we just calculated for the points of intersection if the lines do cross. An easy way to tell if the lines cross? In column F we had previously calculated the difference between the two original data series. If the product of any two adjacent points in column F is negative, the lines intersect between those two points. You should be able to add an IF() checking this at each potential point of intersection without too much trouble.
The next step is to rebuild the three Area data series. Area1 is the transparent base series, Area2 is the positive series, and Area3 is the new negative series.
To create Area1, every other row should point to an entry in the original series in column E. The in-between points should once again be NA() errors if the lines don’t intersect (same for Area2 and Area3 as well), and when they do intersect we just need to calculate the y value at that point. We already have the x value, so we can plug that into our y = mx + b equation. The formula for H5 would be:
=SLOPE(B4:B5,D4:D5)*G5+INTERCEPT(B4:B5,D4:D5)
You could also use the points C4:C5 for your y values as both line formulas will give the same result with that x value (G5).
Area2 and Area3 are incredibly straight forward. We still use the values in column F for every other cell, but the trick is that we only use the positive points in Area2 and only negative points in Area3, with the rest of the points being zero. This is easy to do with something like MAX(F4,0) for Area1 and MIN(F4,0) for Area3. All of the in-between points are either NA() errors (if there is no point of intersection) or zero. If everything worked correctly, your workbook should look like this:
Now you just need to add these new data series to the chart. Series 1 and 2 are the lines which should already be done, Series 3 (the transparent series) should now point to h2:h20, Series 4 (the positive series) should point to the values in column I, and you’ll have to add a Series 5 (negative) to point to the values in column J. The secondary x-axis values also need to be changed to the values in column G.
If your Series 5 didn’t default over to the secondary axes, you’ll have to switch it. Double click on Series 5, click on the “Axis” tab, and select the “Secondary axis” option.
Finally, double click on each area series, go to the “Patterns” tab, choose the two colors you think are the prettiest, and you’re all set.
If everything went correctly, you should have something like this:

If not, the workbook will make more sense than I ever could:
And that’s all there is to it. Let me know what you think in the comments.
– David


KC says
Hi Jon
Perhaps you should be notified that all recent PST Blog I received via email, do not show graphs or tables. Not sure if it is my browser’s fault.
Bob says
Hi David,
Greatly appreciate this post as I have a use for this type of chart straight away…
My question is how to add additional rows of data without breaking the model.
Thanks
Bob
David Montgomery says
Hi Bob,
I think the first thing that would break the model is changing the size of the primary x-axis. In the workbook I was using, cell D4 has the formula:
=INT(1000*A4/15+0.5)
15 is the maximum value for the primary x-axis, so when your axis gets longer this number needs to be updated for all of column D. That should keep the lines and the areas lined up.
Other than that, just make sure you keep the book ends (first and last 2 rows) on columns G:J. For column G, it should begin with 0, end with 1,000, and the first and last real values should repeat. All 3 area series just need to begin and end with two zero cells.
Hope that helps.
-David
Jon Peltier says
KC – Thanks. I’ve noticed this as well. I’ll have to see what’s going on.
Andy Holaday says
Great tips from David and I enjoyed his blog as well. Call me stupid but I can’t seem to comment on his blog directly… I get asked to “Please choose a profile” but none is available.
Jon Peltier says
Andy –
Thanks for your comments. I left a comment on David’s blog, but I have a WordPress account and signed in using it. Maybe that’s the kind of account it wants?
David Montgomery says
Thanks Andy! I don’t actually understand how my blog works sometimes, I thought I had told it to allow anonymous comments but I probably forgot to save the settings. It should work now.
David Chen says
Hi Jon, I have the following set of data:
Year Value 1 Value 2
1980 1,234 1,416
1981 1,358 1,661
1982 1,376 1,958
1983 1,510 2,351
1984 1,778 2,024
1985 2,493 2,330
1986 3,302 2,384
1987 3,871 2,363
1988 3,944 2,339
1989 4,226 2,641
1990 4,066 2,903
1991 4,039 3,665
1992 4,120 3,839
1993 4,490 4,439
1994 4,798 4,535
1995 4,826 5,617
1996 4,916 5,817
1997 4,969 6,601
1998 5,232 7,827
1999 5,256 7,411
2000 5,566 7,746
2001 5,795 8,182
2002 6,937 8,512
2003 8,062 7,390
2004 8,145 6,188
2005 9,142 6,874
2006 9,558 7,528
2007 9,318 8,161
2008 8,984 8,731
There are only 3 intersecting points in years 1985, 1995, and 2003. I follow your method above but my area chart doesn’t fit between my line charts? I wish I can show you the distorted graph that I produce. Any help would be greatly appreciated. Thanks
Manuel says
Can you please update the drop.io link? it is not working.
Sascha says
Hi David,
I could folllow your steps until creating the advanced chart. Would you please describe more detailed?
Thanks,
Sascha
Jon Peltier says
Sascha –
Could you be more specific? Where did you encounter difficulties? Does the sample workbook shed any light?
Sascha says
I’m not able to download the workbook at the moment.
What I did is copy and paste rows “Series 3”, “Series 4” and “Series 5” to the diagram. Then I marked them an put it to the secondary axis. Last step was to change the label of secondary x-axis with the values of row G “2nd X-Axis”.
This ist the chart before rearranging, but with correct computed values (basic version):
http://i45.tinypic.com/2qdwt1c.jpg
This is the chart after rearranging with correct computed values (XY-Area Combo Chart, Montgomery):
http://i50.tinypic.com/30k3xmv.jpg
Sorry for bad english and thanks for the immediate help.
Sascha
Jon Peltier says
Sascha –
Start the chart with the data in columns A, B, and C. Ignore columns D, E, and F. Use the data in columns G through J for the shaded regions: column G for the secondary X values, H for Blank, I for Positive (Value1 > Value2), and J for negative.
Sascha says
Dear Jon,
now it worked. I had to create a complete new chart and not only adapting the old one.
Thanks for your help.
Sascha
Peter says
Thanks for the post. Can you please update the drop.io link? The workbook would help me to understand better.
Jon Peltier says
Peter –
It’s three years old, but I dug out the workbook and posted it on my web site.
Peter says
Thanks Jon! Three years old and still very helpful.
vinvin says
Hi David,
Good morning!
I just want to ask, where did you get this numbers: 2, 3.27, 6.26, 7.58, 8.33, 9.79,11.2, 13.86?
That works if you only have 8 values on Value1 and Value 2.
Please help me have more points up to 12 because i’m using monthly basis on my report; January-December.
Thank you!
-vin
Jon Peltier says
Vin –
Those are arbitrary values used to show that the spacing of X values is not uniform. You can have more rows of values, simply stretch out the entire data range, inserting more rows in between, so that the top and bottom few rows look the same as in the example.
Jose G says
I am wondering if this method can be extended to a dot plot :
Jon Peltier says
Jose –
This approach lends itself to shading between two line chart series, where the line chart and area chart categories are on the horizontal axis. In a dot plot, the “line chart” (really XY Scatter) categories are on the vertical axis, so it’s not a trivial matter to use an area chart to fill between the lines. It can be done, but it’s a lot of manual setting of data, and if the underlying data changes, you have to do all the work again.
My suggestion is to use a color that is a bit less intense for Current Activity, and one that is a lot more intense for UHC Book of Business, so at least the two series in the chart have the same intensity.
Cesar says
Jon,
This is extremely helpful. I made it with my set of data, but have trouble to change the x-axis labels. I understand the base is a scatter plot (two series of data) but I need to have months in the x-axis and compare values through time.
Is there a way to do it?
Thank You
Jon Peltier says
Cesar –
Could you provide a sample of your data?
Stelios says
You are awesome!
Sean says
Credit to the people working on this project. Many years later and this is about the only resource. With the original posting now removed, there is no explanation as to what column D “2nd X axis” represents.
For those using years down the left, I just made them 1 through 6 (for 6 years of data). I changed Column D to divide by 7 and changed my X-axis intervals from 15 to 7. Kept it all in portion but I still don’t know why. Do you happen to have the original posting explanation that got you to the starting point.
Jon Peltier says
Sean –
The old pages cited in the first paragraph have been retired and replaced by a newer article, Fill Under or Between Series in an Excel XY Chart. I have updated the links and will try to fix the redirects.
A similar tutorial is Surplus-Deficit Area Chart.