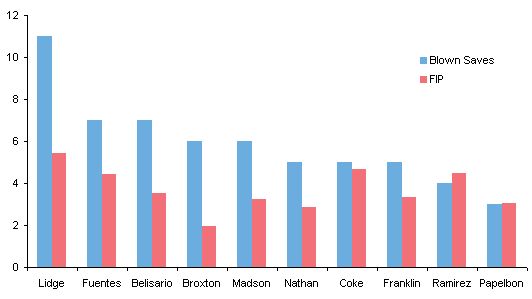
Blown Saves vs. Fielding Independent Pitching shows the following chart comparing Blown Saves to FIP (Fielding Independent Pitching) for ten relief pitchers on the MLB teams that made the 2009 playoffs. Fielding Independent Pitching is a quantity designed to remove the effect of fielding on a pitcher’s statistics.

This is the wrong chart type for a handful of reasons.
First, we all are aware of the evils of 3D charts. The first green bar in this chart has a data label proclaiming a value of 11, but it sure looks much closer to 12 than to 10. Let’s try to improve this with a 2D clustered column chart:
Okay, we can better judge the values of the bars without the 3D-induced parallax.
But what was the analyst trying to show? There was scant description in the post that accompanied the graph.
Is there any relationship between the two measures? A column chart will never show such a relationship.
Here is that same information on an XY chart. There’s a cluster of points in the middle and an outlier (Lidge) in the upper right.

There isn’t a strong dependence of Blown Saves on FIP, as we see from the blue symbols, regression line, and regression equation below. If we throw out the outlier, there’s no relationship at all, illustrated by the red features in the chart.

What was the analyst trying to show? Was he making some comment in the title of the chart?
“When you need them the least”: Does he think these are poor pitchers? What do you think?


Mike Woodhouse says
Given that all the values were shown on the 3D chart, the Y-Axis was superfluous in any case, which would have improved the thing no end. I can see no obvious reason why Papelbon had yellow (ochre?) instead of orangey (burnt umber?). Then again, I know next-to-nothing about baseball having a mind full to capacity with the similar silliness of cricket.
I rather suspect that the analyst started with a premise that turned out not to be of value, but had some solumn inches to fill and went for the sow’s-ear-silk-purse-conversion attempt.
Jon Peltier says
Mike –
There are two clues to the different color for Papelbon’s data point. [1] The post started by saying “With apologies to Boston”, a reference to Papelbon’s team, the Boston Red Sox. [2] Papelbon blew a save the previous night, so his team lost the game and the series, and will watch the rest of the playoffs on television.
DaleW says
Let’s add to the handful of reasons that this is a bad chart.
Even the improved XY chart would capture two conflicting trends: (1) more skill, fewer failures and (2) more skill, more opportunities granted to succeed or fail. Even if a net trend was found, its meaning would be ambiguous.
To try to figure out how much FIP as an indicator of skill matters, instead plot Save % against FIP. (Of course, some relievers on average got tougher save opportunities over the year, but it’s a start.)
Michael says
Hi Jon –
Not knowing how FIP is calculated, I infer from its name and presentation that it is a favorable adjustment to the pitcher. One would presume then that Broxton suffers the most from the laxity of his team-mates, and on a better team, he’d be Mariano Rivera.
So: Where’s Mariano Rivera? Believe he’s got just 2 blown saves this year.
That alone dooms this chart ;-)
…mrt
Matt says
Jon,
Your charts are an improvement over the original.
A useful test I have found for when I’m looking for correlation is a t-test on the R-value. It lets you evaluate whether an r-value is statistically significant or not.
In the case of this data, the Rsq of 0.239 is NOT statistically significant (i.e. I can’t reject the null hypothesis of NO correlation) – The p value is 0.15 and would have to be less than 0.05 to allow me to reject the null hypothesis.
One other comment. What justification do you have that the data for Lidge is an outlier? In my opinion, there was no need to discard since the existing data already shows there is no correlation. Also I would argue that you shouldn’t even plot a regression line on the scatter plot since this implies there is a correlation. You are misleading the reader. I made a similar comment about one of Chandoo’s plots some time back.
Jon Peltier says
Michael –
Wikipedia gives several variations on the calculation of FIP. Essentially it functions as sort of a run index (like ERA), since things like walks and home runs increase FIP.
In the comments under the original chart, the author lamented not including Rivera.
Jon Peltier says
Matt –
I only called Lidge’s point an outlier since it was not part of the cloud of the other pitchers’ data. I looked for a correlation, because I thought the original chart and its labeling asserted that there was some kind of relationship. Removing Lidge’s point from the regression negated the correlation, which supported my calling it an outlier.
It would be interesting to see how all pitchers compare on this chart. Maybe there could be a series of light gray points for all pitchers, to show whether these hand-selected ones really are better.
Matt says
Jon,
I’m not sure I completely agree with your rationale for removing the “outlier”. Just because removing the point supports the point you are trying to make doesn’t make it an outlier. There was no statistically significant correlation to begin with removing the point didn’t really add any value. One might even be able to remove a point that would make the correlation appear to improve so you need an impartial judgement of what is considered an outlier (I don’t know myself what test you would use in this situation).
Your chart highlights that there is no correlation and it is the better/proper format for investigating the potential correlation that was implied by the original chart and labeling. The statistical test lends an impartial perspective to the graphics. I’m sure one could design a chart that shows a correlation the same way other charts lie about magnitudes or relative changes.
Certainly more data would be useful in supporting or refuting the conclusion that there is no correlation. Ten points is never a very good data set.
Dan says
I think this is more interesting as an exercise in how to creatively channel one’s Red Sox grief. Whether the chart is good or bad, it’s better than the ledge of the Zakim Bridge
Jon Peltier says
Dan –
I was at the game Sept 30, the first after they clinched a playoff slot. They put all their scrubs on the field and got cooked 12-0. From that point on, they displayed none of the killer instinct required to succeed in playoff baseball.
I’m disappointed, but certainly not grieving. Unlike most years, I also can’t get excited about the rest of the post-season.
Rebecca says
Matt – There are lots of different tests that statisticians use to determine outliers. I can’t remember what they are called so I’m not much use! I steer clear of regression, correlation etc as I have just enough statistical training to know I’m not doing a good job of it.
Jon Peltier says
Here’s one way to look at the data.
Lidge’s blown saves are the outlier in this chart.
Matt says
You have a good idea, but what do you do with Lidge’s FIP rating? It’s not an outlier. You can’t just throw out 1/2 the data for Lidge.
How about making a box-plot of the regression residuals? Use the Deming regression you demonstrated earlier since both ratings have error associated with them. If Lidge’s point is an outlier then, you probably can justify removing it.
In the only statistics class I ever took, the first thing the professor told us was: “There are lies, damn lies, and statistics.” The approach I like to take is to visualize the data to get a feel for it, then try to apply a statistical test that supports what my visual intuition is telling me. However, like Rebecca, I know that I can get myself into trouble quickly with statistics. Its best (I think) to stick to tests that you understand and use them consistently rather than trying to find a test that supports your position.
I this case, I think we both agree that there isn’t any correlation between FIP and blown saves, we just discussing the best way to show that.
Jon Peltier says
Matt –
I agree, removing Lidge’s data point was an action I took without justification. The test is to compute the supposed regression including Lidge, then plot the residuals, and determine whether they follow a normal distribution. A chi squared test would be a more discerning test than a simple box plot. When I get a free minute.
Sal Paradise says
The graph is bad because of initial design. It is comparing a rate stat (FIP) with a counting stat (Blown Saves) which causes problems because one scales with time played, and one doesn’t.
In other words, let’s say we have Scrappy Cleftchin. He has a 1.23 FIP (really good!) and only one blown save! Obviously this is because he’s an awesome player (and with a name like that, how couldn’t he be?!).
Let’s take Fatso McSucksalot on the other hand. He has a 3.45 FIP (pretty good) and 10 blown saves. Man, he must have problems and be worse than Scrappy Cleftchin, right? I mean, 5 blown saves? Clearly he is no good under pressure.
Only here’s the thing:
Scrappy Cleftchin: 5 IP, 1 save opportunity
Fatso McSucksalot: 120 IP, 80 save opportunities
In other words, the 1.23 FIP is over a really small sample size, and his rate of getting saves is 0% (0/1). Fatso McSucksalot, on the other hand, has pitched twice as many innings as the standard closer at a pretty good rate, and he has a 94% save rate!
It only gets worse when you think about it more.
Sometimes a pitcher comes on to get a save in a 1-run ballgame with the bases loaded and the heart of the batting order coming up. Sometimes a pitcher comes into the game with a 3-run lead, nobody on, and the bottom of the order coming up.
Yet both count equally as saves (and both count equally as blown saves for that matter). So how can we really judge that sort of thing properly?
My basic point is that before we remake the graph, we need to rethink what it’s showing, and whether it’s actually appropriate. In this case, the best graph would be no graph, or just to say, “Papelbon blew it last night” or “Lidge has really choked this year”. Save yourself the space, and all that.
Or you could go into the data and actually show what FIP has to do with save percentage. Mix in leverage index and you may be able to get something halfway decent as a conclusion.
Steve says
To me, the chart you created does a great job of showing that there is nothing to the original proposition.