|
|
|
Creating a Custom Excel Chart TypeSuppose you've made a chart with custom formatting, and you'd like to use this formatting with other charts. You can create and save a custom chart type so that it can be applied to any chart. Start with your optimally formatted chart.
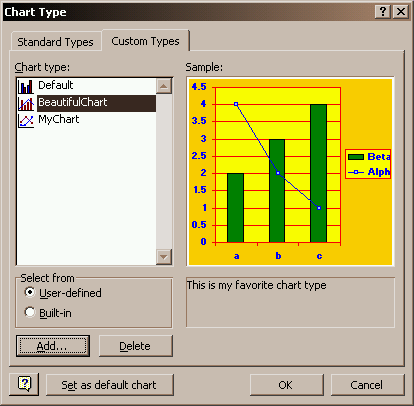
Select the chart and select Chart Type... from the Edit menu, or right click on the chart and select Chart Type... from the pop up menu. Click on the Custom Types tab, and choose the User-Defined option below the list of chart types.
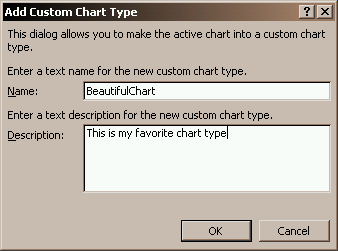
Click the Add button, then fill in a name and description for your chart.
After you press OK, notice that the chart's name appears in the list of user-defined custom chart types, and when this type is selected, the description you entered is displayed below the thumbnail. To make this the default chart type, click on the Set as default chart button. Use the Delete button to remove a user-defined chart type.
Drawback to Applying a Chart Type. When you define a chart as a custom chart type, all the formats from the chart are stored. But the chart type also stores the chart title and axis titles, text as well as font formats. When the chart type is applied to another chart, the font formats are applied to your titles, but the text in the chart type overwrites the text of your titles. This also occurs when one chart's formats are pasted onto another chart. The actual text of the title is part of the properties of the title in VBA, but it would have made more sense to me to treat the text of the titles as data of the chart, not formatting of the chart type. Another problem with a custom chart type, or any chart with customized formatting. If a chart element with custom formatting is removed from the chart, then added again, the custom formatting is lost, and the element takes on the default formatting for that element in the default chart. The custom chart type can be reapplied to the chart to reformat the errant chart element. |

Peltier Technical Services, Inc.Excel Chart Add-Ins | Training | Charts and Tutorials | PTS BlogPeltier Technical Services, Inc., Copyright © 2017. All rights reserved. |