|

|
|
Line and Fill Effects in Excel Radar Charts Using VBA.
Excel charts offer a wide variety of formats, but you can use Excel's drawing tools to enable even more formatting choices. Line and Fill Effects in Excel Charts Using VBA shows how to draw shapes on an XY chart to produce these formats, using the polygon drawing tool. This allows more line formats, by enabling more choices of line thickness and by making it easier to read dashed lines. More fill possibilities are made possible, including transparent fills, allowing gridlines and series to show through the shape.
Drawing a Polygon on a Radar Chart
|
The table at right shows the data set used for this example.
|
| |
A |
B |
C |
D |
| 1 |
|
AA |
BB |
CC |
| 2 |
a |
2 |
3 |
2 |
| 3 |
b |
3 |
2 |
4 |
| 4 |
c |
2 |
3 |
2 |
| 5 |
d |
4 |
2 |
3 |
| 6 |
e |
3 |
3 |
2 |
|
|
This is a normal radar chart made using the data above, with lines connecting markers.
The data is all visible, but the extent of each series is difficult to see. The chart would be more readable if the markers were replaced by filling of the interior of each series with a unique color.
|
|
|
This is another version of the radar chart, formatted with the interior of each series filled.
The spread of each series is obvious, except where the series in front obscure those in back. Transparent fills would make this a more useful chart, but transparent chart series fills are not supported by Excel versions prior to 2007.
|
|
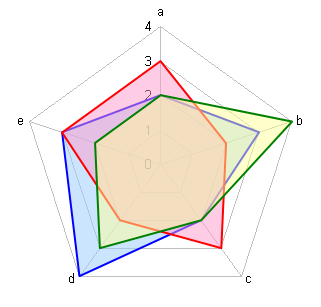
|
This chart shows the functionality of the DrawTransparentShapesOnRadarChart procedure. The code creates a polygon shape with its nodes (corners) on the points of the radar chart series. Each series has a unique color scheme, and the fill is 50% transparent. The colors and percent transparency could be adjusted in the code.
|
|
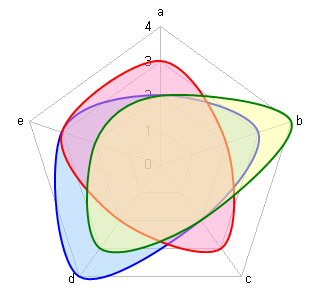
|
This figure demonstrates the enhancements added by the DrawSmoothTransparentShapesOnRadarChart procedure. The nodes of the polygon have been changed from corner points (the default) to straight nodes.
|
|
The VBA Procedures
These procedures draw polygonal shapes, using each point in the series as a node. The procedures first draw a polygonal line from the first point to the last point, including the first point again at the end of the polygon, to produce a filled shape. The X and Y values of each point are converted from the spokes' axis scale to the chart's Left/Top coordinate system, so the polygon accurately traces the series.
The VBA procedures below do not have any error-checking built into them. If a chart is not selected, the procedures will crash. If the active chart is not a Radar chart, the shape will not be correctly drawn, and the procedure may crash before drawing any shape.
The procedures draw shapes with predetermined colors. The VBA code could be adjusted to produce shapes of any desired color scheme, but it may be just as easy for most cases to run the macro, then double click on the shape to open the formatting dialog.
Shapes on a chart are drawn in front of other chart features. Plotted points, labels, and other elements will be obscured by the shapes. The shapes are transparent, but this is not as good as allowing it to be drawn behind other objects.
If the axis scales of the chart change, if rows are added or removed, or if the chart is resized, the shapes will no longer match the radar series properly. In this case, the existing shapes must be deleted and redrawn.
DrawTransparentShapesOnRadarChart: Draw Transparent Polygons that Trace Radar Series
    Sub DrawTransparentShapesOnRadarChart()
      Dim cht As Chart
      Dim srs As Series
      Dim iSrs As Long
      Dim Npts As Integer, Ipts As Integer
      Dim myShape As Shape
      Dim Xnode As Double, Ynode As Double
      Dim Rmax As Double, Rmin As Double
      Dim Xleft As Double, Ytop As Double
      Dim Xwidth As Double, Yheight As Double
      Dim dPI As Double
      Dim iFillColor As Long
      Dim iLineColor As Long

      Set cht = ActiveChart
      Xleft = cht.PlotArea.InsideLeft
      Xwidth = cht.PlotArea.InsideWidth
      Ytop = cht.PlotArea.InsideTop
      Yheight = cht.PlotArea.InsideHeight
      Rmax = cht.Axes(2).MaximumScale
      Rmin = cht.Axes(2).MinimumScale
      dPI = WorksheetFunction.Pi()

      For iSrs = 1 To cht.SeriesCollection.Count

        Set srs = cht.SeriesCollection(iSrs)

        Select Case srs.ChartType
          Case xlRadar, xlRadarFilled, xlRadarMarkers

            Npts = srs.Points.Count

            Xnode = Xleft + Xwidth / 2 * _
                (1 + (srs.Values(Npts) - Rmin) / (Rmax - Rmin) _
                * Sin(2 * dPI * (Npts - 1) / Npts))

            Ynode = Ytop + Yheight / 2 * _
                (1 - (srs.Values(Npts) - Rmin) / (Rmax - Rmin) _
                * Cos(2 * dPI * (Npts - 1) / Npts))

            With cht.Shapes.BuildFreeform _
                (msoEditingAuto, Xnode, Ynode)
              For Ipts = 1 To Npts

                Xnode = Xleft + Xwidth / 2 * _
                    (1 + (srs.Values(Ipts) - Rmin) / (Rmax - Rmin) _
                    * Sin(2 * dPI * (Ipts - 1) / Npts))

                Ynode = Ytop + Yheight / 2 * _
                    (1 - (srs.Values(Ipts) - Rmin) / (Rmax - Rmin) _
                    * Cos(2 * dPI * (Ipts - 1) / Npts))

                .AddNodes msoSegmentLine, msoEditingAuto, _
                    Xnode, Ynode
              Next
              Set myShape = .ConvertToShape
            End With

            Select Case iSrs
              Case 1
                iFillColor = 44
                iLineColor = 12
              Case 2
                iFillColor = 45
                iLineColor = 10
              Case 3
                iFillColor = 43
                iLineColor = 17
            End Select

            With myShape
              .Fill.ForeColor.SchemeColor = iFillColor
              .Line.ForeColor.SchemeColor = iLineColor
              .Line.Weight = 1.5
              .Fill.Transparency = 0.5
            End With
        End Select
      Next

    End Sub
|
DrawSmoothTransparentShapesOnRadarChart: Draw Transparent Smooth Polygons on Radar Chart
    Sub DrawSmoothTransparentShapesOnRadarChart()
      Dim cht As Chart
      Dim srs As Series
      Dim iSrs As Long
      Dim Npts As Integer, Ipts As Integer
      Dim myShape As Shape
      Dim Xnode As Double, Ynode As Double
      Dim Rmax As Double, Rmin As Double
      Dim Xleft As Double, Ytop As Double
      Dim Xwidth As Double, Yheight As Double
      Dim dPI As Double
      Dim iFillColor As Long
      Dim iLineColor As Long

      Set cht = ActiveChart
      Xleft = cht.PlotArea.InsideLeft
      Xwidth = cht.PlotArea.InsideWidth
      Ytop = cht.PlotArea.InsideTop
      Yheight = cht.PlotArea.InsideHeight
      Rmax = cht.Axes(2).MaximumScale
      Rmin = cht.Axes(2).MinimumScale
      dPI = WorksheetFunction.Pi()

      For iSrs = 1 To cht.SeriesCollection.Count

        Set srs = cht.SeriesCollection(iSrs)

        Select Case srs.ChartType
          Case xlRadar, xlRadarFilled, xlRadarMarkers

            Npts = srs.Points.Count

            Xnode = Xleft + Xwidth / 2 * _
                (1 + (srs.Values(Npts) - Rmin) / (Rmax - Rmin) _
                * Sin(2 * dPI * (Npts - 1) / Npts))

            Ynode = Ytop + Yheight / 2 * _
                (1 - (srs.Values(Npts) - Rmin) / (Rmax - Rmin) _
                * Cos(2 * dPI * (Npts - 1) / Npts))

            With cht.Shapes.BuildFreeform _
                (msoEditingAuto, Xnode, Ynode)
              For Ipts = 1 To Npts

                Xnode = Xleft + Xwidth / 2 * _
                    (1 + (srs.Values(Ipts) - Rmin) / (Rmax - Rmin) _
                    * Sin(2 * dPI * (Ipts - 1) / Npts))

                Ynode = Ytop + Yheight / 2 * _
                    (1 - (srs.Values(Ipts) - Rmin) / (Rmax - Rmin) _
                    * Cos(2 * dPI * (Ipts - 1) / Npts))

                .AddNodes msoSegmentLine, msoEditingAuto, _
                    Xnode, Ynode
              Next
              Set myShape = .ConvertToShape
            End With

            For Ipts = 1 To Npts
              myShape.Nodes.SetEditingType 3 * Ipts - 2, msoEditingSmooth
            Next

            Select Case iSrs
              Case 1
                iFillColor = 44
                iLineColor = 12
              Case 2
                iFillColor = 45
                iLineColor = 10
              Case 3
                iFillColor = 43
                iLineColor = 17
            End Select

            With myShape
              .Fill.ForeColor.SchemeColor = iFillColor
              .Line.ForeColor.SchemeColor = iLineColor
              .Line.Weight = 1.5
              .Fill.Transparency = 0.5
            End With
        End Select
      Next

    End Sub
|
|
|


