|
|
|
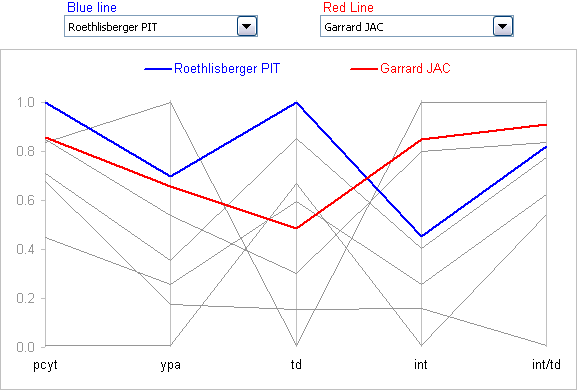
Interactive Parallel Coordinates Chart.In a recent post in the Junk Charts blog, Kaiser cited a New York Times chart comparing the ranks of several NFL quarterbacks in a handful of offensive categories. Kaiser adjusted the NYT rank chart to get a more quantitative comparison of the athletes. I took the same data and made a parallel coordinates chart. A parallel coordinates chart, or profile plot, is a useful way to compare several sets of observations (here, one set per quarterback) of a combination of different factors (offensive categories). The entire population, or at least a broad set of data, is generally shown in a subdued color (the gray lines in the chart) while one or more individuals are highlighted for inspection (the blue and red lines). Stephen Few discusses parallel coordinates charts in Multivariate Analysis Using Parallel Coordinates (html) and Multivariate Analysis Using Parallel Coordinates (pdf).
The DataThe data is a simple set of raw statistics, shown in the following table. I used negative numbers for interceptions, so that more interceptions resulted in a lower number. Note that rows 1-3 and columns B-F are not shown (yet).
To normalize the data, I first determined the minimum and maximum of each statistic in the first two rows. The formula in G1 is
I normalized the data in columns G-K in columns B-F. The formula in cell B5 is
I put the values 1 and 2 into cells L1 and L2, and in cell A1 I entered this formula:
The ChartThe chart is a simple line chart. I selected the range A4:F12, ran the chart wizard, chose Line Chart in step 1, and in step 2 I made sure the series were plotted by row. Below is the chart in all of Excel's default glory.
I made a number of formatting changes. I removed the border and fill of the plot area, I removed the horizontal gridlines, I removed the legend (prematurely), I added vertical gridlines, I set the value (Y) axis maximum to 1, and I set the category (X) axis so the Y axis crossed at the first category, not between categories. I also formatted all series to display with a light gray line and no markers.
To add the highlighted data to the chart, I copied A1:F2, selected the chart, and used Paste Special to add these rows as new series. I formatted one as a thicker blue line and the other as a thicker red line. I left the original light gray lines for these two highlighted series in the chart. I added back the legend so I could display the names of the highlighted athletes.
I deleted all legend entries except for the last two I added. This is done by selecting the legend, then selecting the text part of the legend entry (not the gray line), and pressing Delete. I moved a few chart elements around, and the interactive chart was finished.
One's first thought using Microsoft Excel might be to use a radar chart to display this multivariate data. Each factor is scaled on the spoke of the radar chart. The radar chart below shows why this is a poor option. It is hard to distinguish the circumferential gridlines from the data, but omitting the gridlines removes any value scale at all. Any values of zero are obscured by the jumble at the center of the chart. Besides the overall clutter, it's not clear that the red line goes from about 0.8 at the top (pcyt), to 0.65 (ypa) and 0.5 (td) to the right of the chart, then to above 0.8 to the left (int and int/td). The parallel coordinates chart, on the other hand, allows clear comparisons of the observations along the parallel vertical lines above each category.
A zip file containing my data and chart are found at QuarterbackStats.zip. |
Peltier Technical Services, Inc.Excel Chart Add-Ins | Training | Charts and Tutorials | PTS BlogPeltier Technical Services, Inc., Copyright © 2017. All rights reserved. |