|

|
|
Excel Charts for Statistics.
|
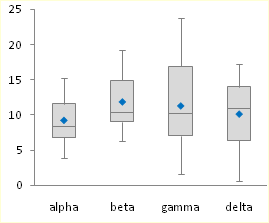
Box and Whisker charts (Box Plots) are commonly used in the display of statistical analyses. Unfortunately, Microsoft Excel does not have a built in Box and Whisker chart type. You can create your own custom Box and Whisker charts, using stacked bar or column charts and error bars, in combination with line or XY scatter chart series to show additional data. The procedures in these tutorials have been updated to show how to add additional series (means of other populations, perhaps, or sets of target values).
|
|
Microsoft Excel does not offer a built in capability to chart probability data, but the technique described here allows you to simulate a probability scale along a chart axis.
Top of Page
|
|

A histogram is a column chart which shows the distribution of a population's values over the range of values. This page examines a few ways to generate histograms in Excel.
Top of Page
|
|
Suppose you want to chart the relative frequency of numbers in a list. Suppose further that instead of a bland column chart, you want to put an X in the histogram for every occurrence of a value. You can do this with a scatter chart, using a procedure offered by Excel MVP Debra Dalgleish in the Microsoft Charting news group.
Top of Page
|
|
Microsoft Excel does not offer a built in capability to draw lines corresponding to statistical values for a series, such as the mean and the mean ± k standard deviations. The example on this page shows how to add statistical indicators to a simple run chart.
Top of Page
|
|
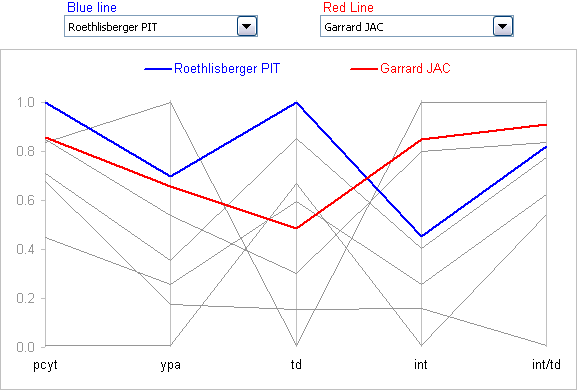
A parallel coordinates chart, or profile plot, is a useful way to compare several sets of observations (here, one set per quarterback) of a combination of different factors (offensive categories). The entire population, or at least a broad set of data, is generally shown in a subdued color (the gray lines in the chart) while one or more individuals are highlighted for inspection (the blue and red lines).
Top of Page
|
|
|


